- United States
- /
- Hospitality
- /
- NasdaqGS:TCOM
Calculating The Intrinsic Value Of Trip.com Group Limited (NASDAQ:TCOM)


Key Insights
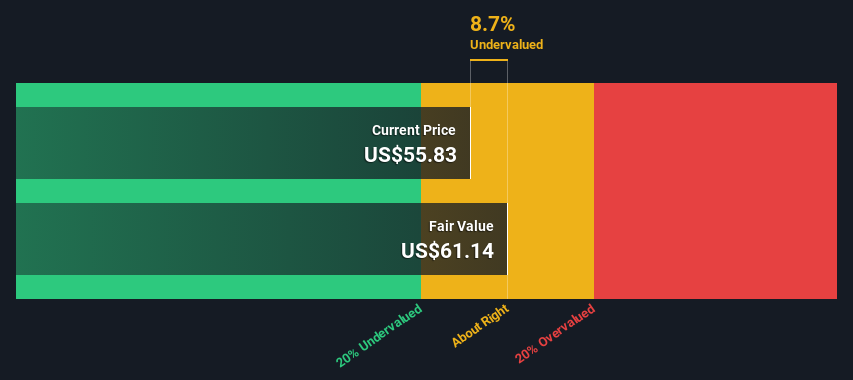
- The projected fair value for Trip.com Group is US$61.14 based on 2 Stage Free Cash Flow to Equity
- Current share price of US$55.83 suggests Trip.com Group is potentially trading close to its fair value
- The CN¥62.32 analyst price target for TCOM is 1.9% more than our estimate of fair value
How far off is Trip.com Group Limited (NASDAQ:TCOM) from its intrinsic value? Using the most recent financial data, we'll take a look at whether the stock is fairly priced by projecting its future cash flows and then discounting them to today's value. The Discounted Cash Flow (DCF) model is the tool we will apply to do this. Before you think you won't be able to understand it, just read on! It's actually much less complex than you'd imagine.
Remember though, that there are many ways to estimate a company's value, and a DCF is just one method. If you still have some burning questions about this type of valuation, take a look at the Simply Wall St analysis model.
Check out our latest analysis for Trip.com Group
Step By Step Through The Calculation
We use what is known as a 2-stage model, which simply means we have two different periods of growth rates for the company's cash flows. Generally the first stage is higher growth, and the second stage is a lower growth phase. In the first stage we need to estimate the cash flows to the business over the next ten years. Where possible we use analyst estimates, but when these aren't available we extrapolate the previous free cash flow (FCF) from the last estimate or reported value. We assume companies with shrinking free cash flow will slow their rate of shrinkage, and that companies with growing free cash flow will see their growth rate slow, over this period. We do this to reflect that growth tends to slow more in the early years than it does in later years.
Generally we assume that a dollar today is more valuable than a dollar in the future, so we need to discount the sum of these future cash flows to arrive at a present value estimate:
10-year free cash flow (FCF) estimate
| 2024 | 2025 | 2026 | 2027 | 2028 | 2029 | 2030 | 2031 | 2032 | 2033 | |
| Levered FCF (CN¥, Millions) | CN¥15.0b | CN¥15.8b | CN¥17.1b | CN¥19.6b | CN¥18.9b | CN¥18.6b | CN¥18.5b | CN¥18.6b | CN¥18.8b | CN¥19.0b |
| Growth Rate Estimate Source | Analyst x2 | Analyst x5 | Analyst x4 | Analyst x2 | Analyst x1 | Est @ -1.61% | Est @ -0.41% | Est @ 0.43% | Est @ 1.01% | Est @ 1.42% |
| Present Value (CN¥, Millions) Discounted @ 7.9% | CN¥13.9k | CN¥13.6k | CN¥13.6k | CN¥14.5k | CN¥12.9k | CN¥11.8k | CN¥10.9k | CN¥10.1k | CN¥9.5k | CN¥8.9k |
("Est" = FCF growth rate estimated by Simply Wall St)
Present Value of 10-year Cash Flow (PVCF) = CN¥120b
The second stage is also known as Terminal Value, this is the business's cash flow after the first stage. The Gordon Growth formula is used to calculate Terminal Value at a future annual growth rate equal to the 5-year average of the 10-year government bond yield of 2.4%. We discount the terminal cash flows to today's value at a cost of equity of 7.9%.
Terminal Value (TV)= FCF2033 × (1 + g) ÷ (r – g) = CN¥19b× (1 + 2.4%) ÷ (7.9%– 2.4%) = CN¥355b
Present Value of Terminal Value (PVTV)= TV / (1 + r)10= CN¥355b÷ ( 1 + 7.9%)10= CN¥166b
The total value, or equity value, is then the sum of the present value of the future cash flows, which in this case is CN¥286b. To get the intrinsic value per share, we divide this by the total number of shares outstanding. Compared to the current share price of US$55.8, the company appears about fair value at a 8.7% discount to where the stock price trades currently. Valuations are imprecise instruments though, rather like a telescope - move a few degrees and end up in a different galaxy. Do keep this in mind.
The Assumptions
The calculation above is very dependent on two assumptions. The first is the discount rate and the other is the cash flows. You don't have to agree with these inputs, I recommend redoing the calculations yourself and playing with them. The DCF also does not consider the possible cyclicality of an industry, or a company's future capital requirements, so it does not give a full picture of a company's potential performance. Given that we are looking at Trip.com Group as potential shareholders, the cost of equity is used as the discount rate, rather than the cost of capital (or weighted average cost of capital, WACC) which accounts for debt. In this calculation we've used 7.9%, which is based on a levered beta of 1.194. Beta is a measure of a stock's volatility, compared to the market as a whole. We get our beta from the industry average beta of globally comparable companies, with an imposed limit between 0.8 and 2.0, which is a reasonable range for a stable business.
SWOT Analysis for Trip.com Group
- Earnings growth over the past year exceeded the industry.
- Debt is not viewed as a risk.
- No major weaknesses identified for TCOM.
- Annual earnings are forecast to grow for the next .
- Current share price is below our estimate of fair value.
- Annual earnings are forecast to grow slower than the American market.
Next Steps:
Although the valuation of a company is important, it shouldn't be the only metric you look at when researching a company. DCF models are not the be-all and end-all of investment valuation. Rather it should be seen as a guide to "what assumptions need to be true for this stock to be under/overvalued?" For example, changes in the company's cost of equity or the risk free rate can significantly impact the valuation. For Trip.com Group, we've put together three important items you should explore:
- Financial Health: Does TCOM have a healthy balance sheet? Take a look at our free balance sheet analysis with six simple checks on key factors like leverage and risk.
- Future Earnings: How does TCOM's growth rate compare to its peers and the wider market? Dig deeper into the analyst consensus number for the upcoming years by interacting with our free analyst growth expectation chart.
- Other Solid Businesses: Low debt, high returns on equity and good past performance are fundamental to a strong business. Why not explore our interactive list of stocks with solid business fundamentals to see if there are other companies you may not have considered!
PS. The Simply Wall St app conducts a discounted cash flow valuation for every stock on the NASDAQGS every day. If you want to find the calculation for other stocks just search here.
If you're looking to trade Trip.com Group, open an account with the lowest-cost platform trusted by professionals, Interactive Brokers.
With clients in over 200 countries and territories, and access to 160 markets, IBKR lets you trade stocks, options, futures, forex, bonds and funds from a single integrated account.
Enjoy no hidden fees, no account minimums, and FX conversion rates as low as 0.03%, far better than what most brokers offer.
Sponsored ContentValuation is complex, but we're here to simplify it.
Discover if Trip.com Group might be undervalued or overvalued with our detailed analysis, featuring fair value estimates, potential risks, dividends, insider trades, and its financial condition.
Access Free AnalysisHave feedback on this article? Concerned about the content? Get in touch with us directly. Alternatively, email editorial-team (at) simplywallst.com.
This article by Simply Wall St is general in nature. We provide commentary based on historical data and analyst forecasts only using an unbiased methodology and our articles are not intended to be financial advice. It does not constitute a recommendation to buy or sell any stock, and does not take account of your objectives, or your financial situation. We aim to bring you long-term focused analysis driven by fundamental data. Note that our analysis may not factor in the latest price-sensitive company announcements or qualitative material. Simply Wall St has no position in any stocks mentioned.
About NasdaqGS:TCOM
Trip.com Group
Through its subsidiaries, operates as a travel service provider for accommodation reservation, transportation ticketing, packaged tours, in-destination, corporate travel management, and other travel-related services in China and internationally.
Very undervalued with flawless balance sheet.
Similar Companies
Market Insights

Community Narratives

