- United States
- /
- Hospitality
- /
- NasdaqGS:MAR
Estimating The Intrinsic Value Of Marriott International, Inc. (NASDAQ:MAR)


Key Insights
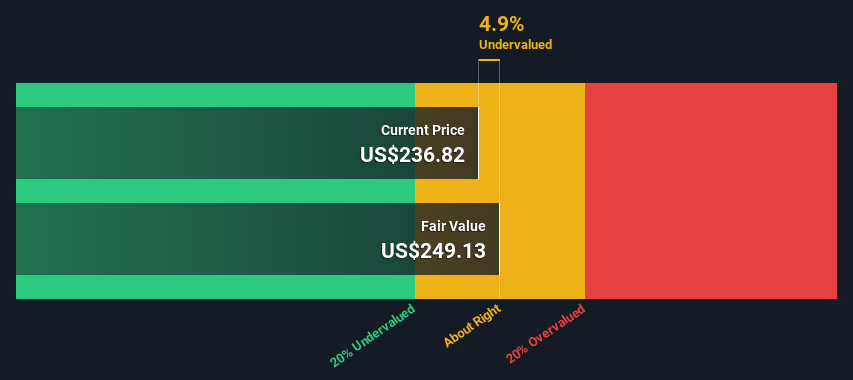
- Using the 2 Stage Free Cash Flow to Equity, Marriott International fair value estimate is US$249
- Marriott International's US$237 share price indicates it is trading at similar levels as its fair value estimate
- Analyst price target for MAR is US$247 which is similar to our fair value estimate
How far off is Marriott International, Inc. (NASDAQ:MAR) from its intrinsic value? Using the most recent financial data, we'll take a look at whether the stock is fairly priced by estimating the company's future cash flows and discounting them to their present value. We will take advantage of the Discounted Cash Flow (DCF) model for this purpose. It may sound complicated, but actually it is quite simple!
We would caution that there are many ways of valuing a company and, like the DCF, each technique has advantages and disadvantages in certain scenarios. For those who are keen learners of equity analysis, the Simply Wall St analysis model here may be something of interest to you.
Check out our latest analysis for Marriott International
The Model
We use what is known as a 2-stage model, which simply means we have two different periods of growth rates for the company's cash flows. Generally the first stage is higher growth, and the second stage is a lower growth phase. To start off with, we need to estimate the next ten years of cash flows. Where possible we use analyst estimates, but when these aren't available we extrapolate the previous free cash flow (FCF) from the last estimate or reported value. We assume companies with shrinking free cash flow will slow their rate of shrinkage, and that companies with growing free cash flow will see their growth rate slow, over this period. We do this to reflect that growth tends to slow more in the early years than it does in later years.
Generally we assume that a dollar today is more valuable than a dollar in the future, and so the sum of these future cash flows is then discounted to today's value:
10-year free cash flow (FCF) forecast
| 2024 | 2025 | 2026 | 2027 | 2028 | 2029 | 2030 | 2031 | 2032 | 2033 | |
| Levered FCF ($, Millions) | US$2.71b | US$2.92b | US$3.27b | US$3.64b | US$4.06b | US$4.37b | US$4.63b | US$4.86b | US$5.06b | US$5.24b |
| Growth Rate Estimate Source | Analyst x5 | Analyst x5 | Analyst x1 | Analyst x1 | Analyst x1 | Est @ 7.61% | Est @ 6.04% | Est @ 4.94% | Est @ 4.17% | Est @ 3.64% |
| Present Value ($, Millions) Discounted @ 7.9% | US$2.5k | US$2.5k | US$2.6k | US$2.7k | US$2.8k | US$2.8k | US$2.7k | US$2.6k | US$2.5k | US$2.4k |
("Est" = FCF growth rate estimated by Simply Wall St)
Present Value of 10-year Cash Flow (PVCF) = US$26b
After calculating the present value of future cash flows in the initial 10-year period, we need to calculate the Terminal Value, which accounts for all future cash flows beyond the first stage. The Gordon Growth formula is used to calculate Terminal Value at a future annual growth rate equal to the 5-year average of the 10-year government bond yield of 2.4%. We discount the terminal cash flows to today's value at a cost of equity of 7.9%.
Terminal Value (TV)= FCF2033 × (1 + g) ÷ (r – g) = US$5.2b× (1 + 2.4%) ÷ (7.9%– 2.4%) = US$97b
Present Value of Terminal Value (PVTV)= TV / (1 + r)10= US$97b÷ ( 1 + 7.9%)10= US$45b
The total value is the sum of cash flows for the next ten years plus the discounted terminal value, which results in the Total Equity Value, which in this case is US$71b. The last step is to then divide the equity value by the number of shares outstanding. Compared to the current share price of US$237, the company appears about fair value at a 4.9% discount to where the stock price trades currently. Remember though, that this is just an approximate valuation, and like any complex formula - garbage in, garbage out.
Important Assumptions
The calculation above is very dependent on two assumptions. The first is the discount rate and the other is the cash flows. Part of investing is coming up with your own evaluation of a company's future performance, so try the calculation yourself and check your own assumptions. The DCF also does not consider the possible cyclicality of an industry, or a company's future capital requirements, so it does not give a full picture of a company's potential performance. Given that we are looking at Marriott International as potential shareholders, the cost of equity is used as the discount rate, rather than the cost of capital (or weighted average cost of capital, WACC) which accounts for debt. In this calculation we've used 7.9%, which is based on a levered beta of 1.209. Beta is a measure of a stock's volatility, compared to the market as a whole. We get our beta from the industry average beta of globally comparable companies, with an imposed limit between 0.8 and 2.0, which is a reasonable range for a stable business.
SWOT Analysis for Marriott International
- Debt is well covered by earnings and cashflows.
- Dividends are covered by earnings and cash flows.
- Earnings growth over the past year underperformed the Hospitality industry.
- Dividend is low compared to the top 25% of dividend payers in the Hospitality market.
- Annual revenue is forecast to grow faster than the American market.
- Good value based on P/E ratio and estimated fair value.
- Total liabilities exceed total assets, which raises the risk of financial distress.
- Annual earnings are forecast to grow slower than the American market.
Moving On:
Valuation is only one side of the coin in terms of building your investment thesis, and it shouldn't be the only metric you look at when researching a company. DCF models are not the be-all and end-all of investment valuation. Preferably you'd apply different cases and assumptions and see how they would impact the company's valuation. For instance, if the terminal value growth rate is adjusted slightly, it can dramatically alter the overall result. For Marriott International, we've put together three fundamental factors you should consider:
- Risks: Case in point, we've spotted 2 warning signs for Marriott International you should be aware of.
- Management:Have insiders been ramping up their shares to take advantage of the market's sentiment for MAR's future outlook? Check out our management and board analysis with insights on CEO compensation and governance factors.
- Other Solid Businesses: Low debt, high returns on equity and good past performance are fundamental to a strong business. Why not explore our interactive list of stocks with solid business fundamentals to see if there are other companies you may not have considered!
PS. The Simply Wall St app conducts a discounted cash flow valuation for every stock on the NASDAQGS every day. If you want to find the calculation for other stocks just search here.
New: Manage All Your Stock Portfolios in One Place
We've created the ultimate portfolio companion for stock investors, and it's free.
• Connect an unlimited number of Portfolios and see your total in one currency
• Be alerted to new Warning Signs or Risks via email or mobile
• Track the Fair Value of your stocks
Have feedback on this article? Concerned about the content? Get in touch with us directly. Alternatively, email editorial-team (at) simplywallst.com.
This article by Simply Wall St is general in nature. We provide commentary based on historical data and analyst forecasts only using an unbiased methodology and our articles are not intended to be financial advice. It does not constitute a recommendation to buy or sell any stock, and does not take account of your objectives, or your financial situation. We aim to bring you long-term focused analysis driven by fundamental data. Note that our analysis may not factor in the latest price-sensitive company announcements or qualitative material. Simply Wall St has no position in any stocks mentioned.
About NasdaqGS:MAR
Marriott International
Engages in operating, franchising, and licensing hotel, residential, timeshare, and other lodging properties worldwide.
Fair value with moderate growth potential.
