
Advertisement
- United States
- /
- Hospitality
- /
- NasdaqCM:DENN
Is Denny's Corporation (NASDAQ:DENN) Worth US$11.2 Based On Its Intrinsic Value?
Key Insights
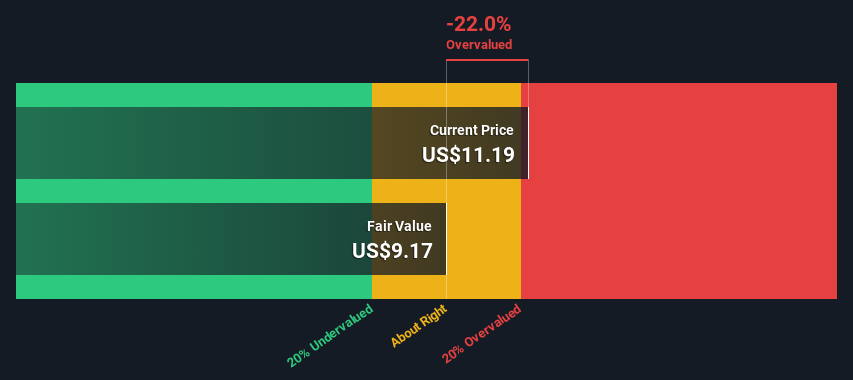
- Using the 2 Stage Free Cash Flow to Equity, Denny's fair value estimate is US$9.17
- Denny's' US$11.19 share price signals that it might be 22% overvalued
- Analyst price target for DENN is US$14.17, which is 54% above our fair value estimate
Today we'll do a simple run through of a valuation method used to estimate the attractiveness of Denny's Corporation (NASDAQ:DENN) as an investment opportunity by taking the forecast future cash flows of the company and discounting them back to today's value. We will take advantage of the Discounted Cash Flow (DCF) model for this purpose. Believe it or not, it's not too difficult to follow, as you'll see from our example!
We would caution that there are many ways of valuing a company and, like the DCF, each technique has advantages and disadvantages in certain scenarios. Anyone interested in learning a bit more about intrinsic value should have a read of the Simply Wall St analysis model.
Check out our latest analysis for Denny's
The Calculation
We use what is known as a 2-stage model, which simply means we have two different periods of growth rates for the company's cash flows. Generally the first stage is higher growth, and the second stage is a lower growth phase. In the first stage we need to estimate the cash flows to the business over the next ten years. Where possible we use analyst estimates, but when these aren't available we extrapolate the previous free cash flow (FCF) from the last estimate or reported value. We assume companies with shrinking free cash flow will slow their rate of shrinkage, and that companies with growing free cash flow will see their growth rate slow, over this period. We do this to reflect that growth tends to slow more in the early years than it does in later years.
A DCF is all about the idea that a dollar in the future is less valuable than a dollar today, so we need to discount the sum of these future cash flows to arrive at a present value estimate:
10-year free cash flow (FCF) forecast
| 2024 | 2025 | 2026 | 2027 | 2028 | 2029 | 2030 | 2031 | 2032 | 2033 | |
| Levered FCF ($, Millions) | US$60.9m | US$53.7m | US$49.6m | US$47.3m | US$46.0m | US$45.4m | US$45.3m | US$45.6m | US$46.0m | US$46.6m |
| Growth Rate Estimate Source | Analyst x1 | Est @ -11.82% | Est @ -7.64% | Est @ -4.72% | Est @ -2.67% | Est @ -1.23% | Est @ -0.23% | Est @ 0.47% | Est @ 0.96% | Est @ 1.31% |
| Present Value ($, Millions) Discounted @ 10% | US$55.2 | US$44.1 | US$36.9 | US$31.8 | US$28.1 | US$25.1 | US$22.7 | US$20.6 | US$18.9 | US$17.3 |
("Est" = FCF growth rate estimated by Simply Wall St)
Present Value of 10-year Cash Flow (PVCF) = US$301m
The second stage is also known as Terminal Value, this is the business's cash flow after the first stage. For a number of reasons a very conservative growth rate is used that cannot exceed that of a country's GDP growth. In this case we have used the 5-year average of the 10-year government bond yield (2.1%) to estimate future growth. In the same way as with the 10-year 'growth' period, we discount future cash flows to today's value, using a cost of equity of 10%.
Terminal Value (TV)= FCF2033 × (1 + g) ÷ (r – g) = US$47m× (1 + 2.1%) ÷ (10%– 2.1%) = US$574m
Present Value of Terminal Value (PVTV)= TV / (1 + r)10= US$574m÷ ( 1 + 10%)10= US$213m
The total value, or equity value, is then the sum of the present value of the future cash flows, which in this case is US$514m. The last step is to then divide the equity value by the number of shares outstanding. Compared to the current share price of US$11.2, the company appears slightly overvalued at the time of writing. Remember though, that this is just an approximate valuation, and like any complex formula - garbage in, garbage out.
The Assumptions
The calculation above is very dependent on two assumptions. The first is the discount rate and the other is the cash flows. If you don't agree with these result, have a go at the calculation yourself and play with the assumptions. The DCF also does not consider the possible cyclicality of an industry, or a company's future capital requirements, so it does not give a full picture of a company's potential performance. Given that we are looking at Denny's as potential shareholders, the cost of equity is used as the discount rate, rather than the cost of capital (or weighted average cost of capital, WACC) which accounts for debt. In this calculation we've used 10%, which is based on a levered beta of 1.395. Beta is a measure of a stock's volatility, compared to the market as a whole. We get our beta from the industry average beta of globally comparable companies, with an imposed limit between 0.8 and 2.0, which is a reasonable range for a stable business.
SWOT Analysis for Denny's
Strength
- Debt is well covered by earnings and cashflows.
Weakness
- Earnings declined over the past year.
- Expensive based on P/E ratio and estimated fair value.
Opportunity
- DENN's financial characteristics indicate limited near-term opportunities for shareholders.
Threat
- Total liabilities exceed total assets, which raises the risk of financial distress.
- Annual earnings are forecast to decline for the next 2 years.
Moving On:
Whilst important, the DCF calculation is only one of many factors that you need to assess for a company. DCF models are not the be-all and end-all of investment valuation. Rather it should be seen as a guide to "what assumptions need to be true for this stock to be under/overvalued?" For example, changes in the company's cost of equity or the risk free rate can significantly impact the valuation. Can we work out why the company is trading at a premium to intrinsic value? For Denny's, there are three important factors you should explore:
- Risks: To that end, you should learn about the 4 warning signs we've spotted with Denny's (including 1 which makes us a bit uncomfortable) .
- Future Earnings: How does DENN's growth rate compare to its peers and the wider market? Dig deeper into the analyst consensus number for the upcoming years by interacting with our free analyst growth expectation chart.
- Other High Quality Alternatives: Do you like a good all-rounder? Explore our interactive list of high quality stocks to get an idea of what else is out there you may be missing!
PS. The Simply Wall St app conducts a discounted cash flow valuation for every stock on the NASDAQCM every day. If you want to find the calculation for other stocks just search here.
New: Manage All Your Stock Portfolios in One Place
We've created the ultimate portfolio companion for stock investors, and it's free.
• Connect an unlimited number of Portfolios and see your total in one currency
• Be alerted to new Warning Signs or Risks via email or mobile
• Track the Fair Value of your stocks
Have feedback on this article? Concerned about the content? Get in touch with us directly. Alternatively, email editorial-team (at) simplywallst.com.
This article by Simply Wall St is general in nature. We provide commentary based on historical data and analyst forecasts only using an unbiased methodology and our articles are not intended to be financial advice. It does not constitute a recommendation to buy or sell any stock, and does not take account of your objectives, or your financial situation. We aim to bring you long-term focused analysis driven by fundamental data. Note that our analysis may not factor in the latest price-sensitive company announcements or qualitative material. Simply Wall St has no position in any stocks mentioned.
About NasdaqCM:DENN
Denny's
Through its subsidiaries, owns and operates franchised full-service restaurant chains under the Denny's and Keke’s Breakfast Cafe brand names in the United States and internationally.
Fair value with low risk.
Market Insights


Advertisement
Community Narratives
America Wants Homegrown Drones — Draganfly Is Ready to Deliver
Fair Value US$9.21|27.4% undervalued
JO
Community Contributor
Cheesecake Factory offers an enticing opportunity for long-term growth by leveraging new concepts
Fair Value US$73.83|25.8% undervalued
ZW
Community Contributor
Coca-Cola’s Intrinsic Value Set to Rise with Fed Rate Cut
Fair Value US$67.50|2.7% undervalued
AL
Community Contributor
Fully Permitted Gold Mine with 50 Baggers Potential 
Fair Value CA$41.00|98.0% undervalued
RO
Community Contributor