- United States
- /
- Hospitality
- /
- NasdaqGS:BLMN
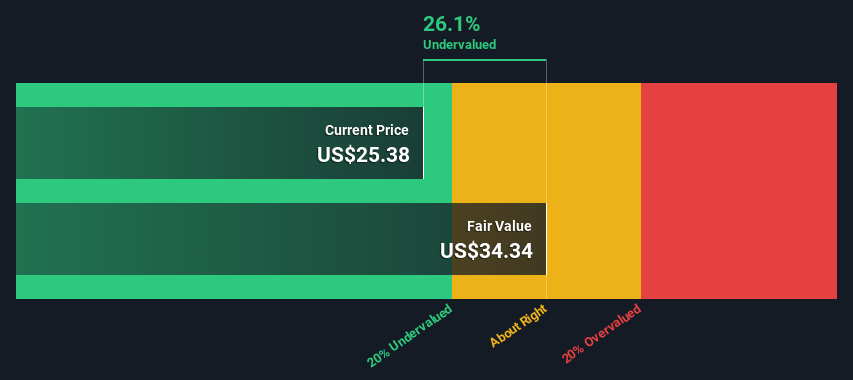
Is There An Opportunity With Bloomin' Brands, Inc.'s (NASDAQ:BLMN) 26% Undervaluation?


Key Insights
- Bloomin' Brands' estimated fair value is US$34.34 based on 2 Stage Free Cash Flow to Equity
- Current share price of US$25.38 suggests Bloomin' Brands is potentially 26% undervalued
- Analyst price target for BLMN is US$28.00 which is 18% below our fair value estimate
Does the January share price for Bloomin' Brands, Inc. (NASDAQ:BLMN) reflect what it's really worth? Today, we will estimate the stock's intrinsic value by estimating the company's future cash flows and discounting them to their present value. Our analysis will employ the Discounted Cash Flow (DCF) model. Before you think you won't be able to understand it, just read on! It's actually much less complex than you'd imagine.
Companies can be valued in a lot of ways, so we would point out that a DCF is not perfect for every situation. For those who are keen learners of equity analysis, the Simply Wall St analysis model here may be something of interest to you.
View our latest analysis for Bloomin' Brands
Step By Step Through The Calculation
We're using the 2-stage growth model, which simply means we take in account two stages of company's growth. In the initial period the company may have a higher growth rate and the second stage is usually assumed to have a stable growth rate. In the first stage we need to estimate the cash flows to the business over the next ten years. Where possible we use analyst estimates, but when these aren't available we extrapolate the previous free cash flow (FCF) from the last estimate or reported value. We assume companies with shrinking free cash flow will slow their rate of shrinkage, and that companies with growing free cash flow will see their growth rate slow, over this period. We do this to reflect that growth tends to slow more in the early years than it does in later years.
A DCF is all about the idea that a dollar in the future is less valuable than a dollar today, and so the sum of these future cash flows is then discounted to today's value:
10-year free cash flow (FCF) estimate
| 2024 | 2025 | 2026 | 2027 | 2028 | 2029 | 2030 | 2031 | 2032 | 2033 | |
| Levered FCF ($, Millions) | US$303.0m | US$255.0m | US$255.8m | US$258.1m | US$261.4m | US$265.5m | US$270.2m | US$275.4m | US$280.9m | US$286.7m |
| Growth Rate Estimate Source | Analyst x3 | Analyst x1 | Est @ 0.32% | Est @ 0.89% | Est @ 1.29% | Est @ 1.57% | Est @ 1.76% | Est @ 1.90% | Est @ 2.00% | Est @ 2.06% |
| Present Value ($, Millions) Discounted @ 10% | US$275 | US$209 | US$190 | US$174 | US$160 | US$147 | US$136 | US$125 | US$116 | US$107 |
("Est" = FCF growth rate estimated by Simply Wall St)
Present Value of 10-year Cash Flow (PVCF) = US$1.6b
We now need to calculate the Terminal Value, which accounts for all the future cash flows after this ten year period. The Gordon Growth formula is used to calculate Terminal Value at a future annual growth rate equal to the 5-year average of the 10-year government bond yield of 2.2%. We discount the terminal cash flows to today's value at a cost of equity of 10%.
Terminal Value (TV)= FCF2033 × (1 + g) ÷ (r – g) = US$287m× (1 + 2.2%) ÷ (10%– 2.2%) = US$3.6b
Present Value of Terminal Value (PVTV)= TV / (1 + r)10= US$3.6b÷ ( 1 + 10%)10= US$1.3b
The total value, or equity value, is then the sum of the present value of the future cash flows, which in this case is US$3.0b. To get the intrinsic value per share, we divide this by the total number of shares outstanding. Compared to the current share price of US$25.4, the company appears a touch undervalued at a 26% discount to where the stock price trades currently. The assumptions in any calculation have a big impact on the valuation, so it is better to view this as a rough estimate, not precise down to the last cent.
The Assumptions
Now the most important inputs to a discounted cash flow are the discount rate, and of course, the actual cash flows. Part of investing is coming up with your own evaluation of a company's future performance, so try the calculation yourself and check your own assumptions. The DCF also does not consider the possible cyclicality of an industry, or a company's future capital requirements, so it does not give a full picture of a company's potential performance. Given that we are looking at Bloomin' Brands as potential shareholders, the cost of equity is used as the discount rate, rather than the cost of capital (or weighted average cost of capital, WACC) which accounts for debt. In this calculation we've used 10%, which is based on a levered beta of 1.628. Beta is a measure of a stock's volatility, compared to the market as a whole. We get our beta from the industry average beta of globally comparable companies, with an imposed limit between 0.8 and 2.0, which is a reasonable range for a stable business.
SWOT Analysis for Bloomin' Brands
- Earnings growth over the past year exceeded the industry.
- Debt is well covered by earnings and cashflows.
- Dividends are covered by earnings and cash flows.
- Dividend is low compared to the top 25% of dividend payers in the Hospitality market.
- Good value based on P/E ratio and estimated fair value.
- Annual earnings are forecast to decline for the next 4 years.
Next Steps:
Valuation is only one side of the coin in terms of building your investment thesis, and it is only one of many factors that you need to assess for a company. DCF models are not the be-all and end-all of investment valuation. Preferably you'd apply different cases and assumptions and see how they would impact the company's valuation. If a company grows at a different rate, or if its cost of equity or risk free rate changes sharply, the output can look very different. Can we work out why the company is trading at a discount to intrinsic value? For Bloomin' Brands, there are three relevant aspects you should further examine:
- Risks: Take risks, for example - Bloomin' Brands has 3 warning signs (and 1 which is potentially serious) we think you should know about.
- Future Earnings: How does BLMN's growth rate compare to its peers and the wider market? Dig deeper into the analyst consensus number for the upcoming years by interacting with our free analyst growth expectation chart.
- Other High Quality Alternatives: Do you like a good all-rounder? Explore our interactive list of high quality stocks to get an idea of what else is out there you may be missing!
PS. The Simply Wall St app conducts a discounted cash flow valuation for every stock on the NASDAQGS every day. If you want to find the calculation for other stocks just search here.
If you're looking to trade Bloomin' Brands, open an account with the lowest-cost platform trusted by professionals, Interactive Brokers.
With clients in over 200 countries and territories, and access to 160 markets, IBKR lets you trade stocks, options, futures, forex, bonds and funds from a single integrated account.
Enjoy no hidden fees, no account minimums, and FX conversion rates as low as 0.03%, far better than what most brokers offer.
Sponsored ContentValuation is complex, but we're here to simplify it.
Discover if Bloomin' Brands might be undervalued or overvalued with our detailed analysis, featuring fair value estimates, potential risks, dividends, insider trades, and its financial condition.
Access Free AnalysisHave feedback on this article? Concerned about the content? Get in touch with us directly. Alternatively, email editorial-team (at) simplywallst.com.
This article by Simply Wall St is general in nature. We provide commentary based on historical data and analyst forecasts only using an unbiased methodology and our articles are not intended to be financial advice. It does not constitute a recommendation to buy or sell any stock, and does not take account of your objectives, or your financial situation. We aim to bring you long-term focused analysis driven by fundamental data. Note that our analysis may not factor in the latest price-sensitive company announcements or qualitative material. Simply Wall St has no position in any stocks mentioned.
About NasdaqGS:BLMN
Bloomin' Brands
Through its subsidiaries, owns and operates casual, polished casual, and fine dining restaurants in the United States and internationally.
Undervalued slight.
Market Insights

Community Narratives

