Advertisement
- United States
- /
- Consumer Durables
- /
- NYSE:LEN
How High Can Lennar Go After 22% Rally and Strong Earnings Report?

Simply Wall St
Reviewed by Simply Wall St
Thinking about what to do with Lennar stock right now? You are not alone. After all, Lennar’s share price has taken investors on a surprisingly lively ride lately. Over the last 30 days, the stock jumped an impressive 22.5%, while the 90-day picture looks even rosier with a surge of nearly 27%. Results like these can make anyone wonder if there is still room to run or if all the growth has been priced in. Of course, there was a rough patch earlier this year, and the one-year return is still down about 15%. Looking back further reveals that Lennar has essentially doubled shareholders’ money over the past five years, which is quite a feat for a homebuilder navigating a challenging market.
Much of this momentum reflects shifting sentiment about the risks and opportunities facing the homebuilding sector. Investors have been weighing everything from elevated mortgage rates to the persistent lack of housing supply in the U.S., in addition to the company’s own solid revenue growth and the occasional dip in profits. If you are trying to decide whether Lennar is undervalued, fairly valued, or skating a little too close to perfection, you will be interested in its latest value score. Out of six different valuation checks, Lennar registers at a 3, meaning it is considered undervalued in three of them.
So, how exactly do these valuation methods stack up, and what can they really tell us about Lennar’s upside from here? Let’s break down each approach one by one, then look at what might be the most important factor of all: the piece of the valuation puzzle that investors often overlook.
Lennar delivered -15.2% returns over the last year. See how this stacks up to the rest of the Consumer Durables industry.Approach 1: Lennar Cash Flows
The Discounted Cash Flow (DCF) model estimates a company’s value by projecting its future cash flows and discounting them back to their present worth. For Lennar, this approach begins with current Free Cash Flow, which stands at $278 million, and evaluates how those cash flows might evolve over the next decade.
Analyst projections expect Lennar’s annual Free Cash Flow to reach nearly $2 billion ($2,008 million) by 2035, reflecting steady growth over the period. Using a 2 Stage Free Cash Flow to Equity valuation model, the DCF method calculates Lennar’s estimated intrinsic value at $113.11 per share.
When comparing this intrinsic value to Lennar’s actual share price, the results suggest the stock is about 18.7% overvalued based on this model. In other words, the market price is currently higher than where the company’s discounted future cash flows would place it.
Result: OVERVALUED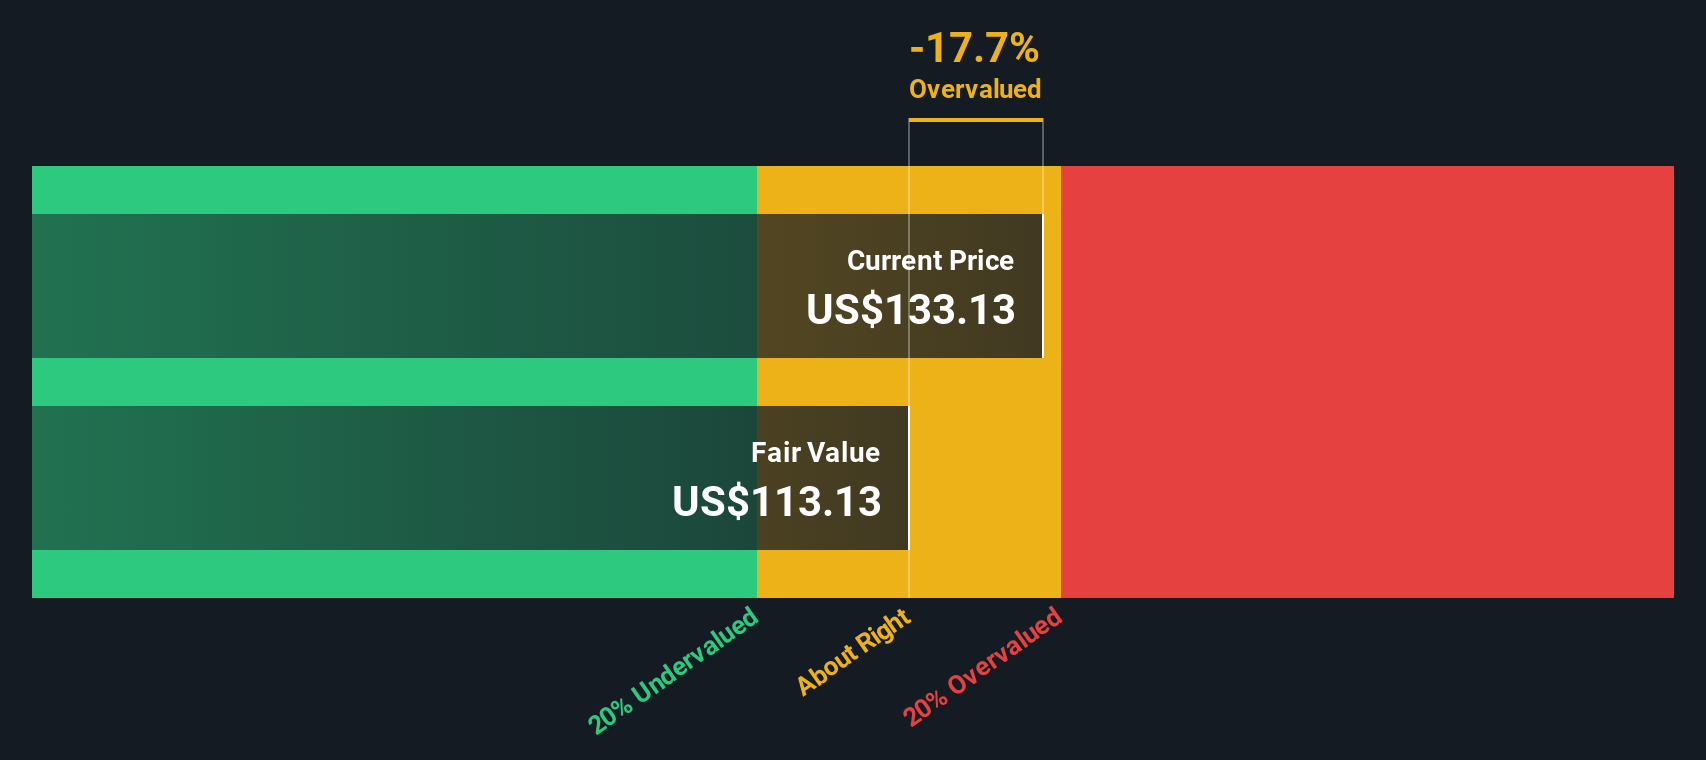
Approach 2: Lennar Price vs Earnings
When it comes to valuing consistently profitable companies like Lennar, the Price-to-Earnings (PE) ratio is a widely used and effective metric. This ratio helps investors see how much they are paying for each dollar of the company's net earnings, which is particularly relevant for established businesses with steady profitability.
The appropriate or fair PE ratio for a stock is influenced by factors such as growth prospects, profit margins, and the level of risk in the business. If a company is expected to grow earnings rapidly or carries lower risk than its peers, it can typically justify a higher PE ratio compared to the industry average. On the other hand, if growth is limited or the business faces significant risks, a lower multiple may be more suitable.
Lennar currently trades at a PE ratio of 10.79x. For context, the peer average is 11.75x and the Consumer Durables industry average is 11.13x. Simply Wall St’s Fair Ratio for Lennar is 12.68x, a figure that considers the company’s growth outlook, profitability, market size, and risk factors. Since Lennar’s actual PE ratio is noticeably below this fair value benchmark, the numbers suggest the stock may be undervalued on an earnings basis.
Result: UNDERVALUED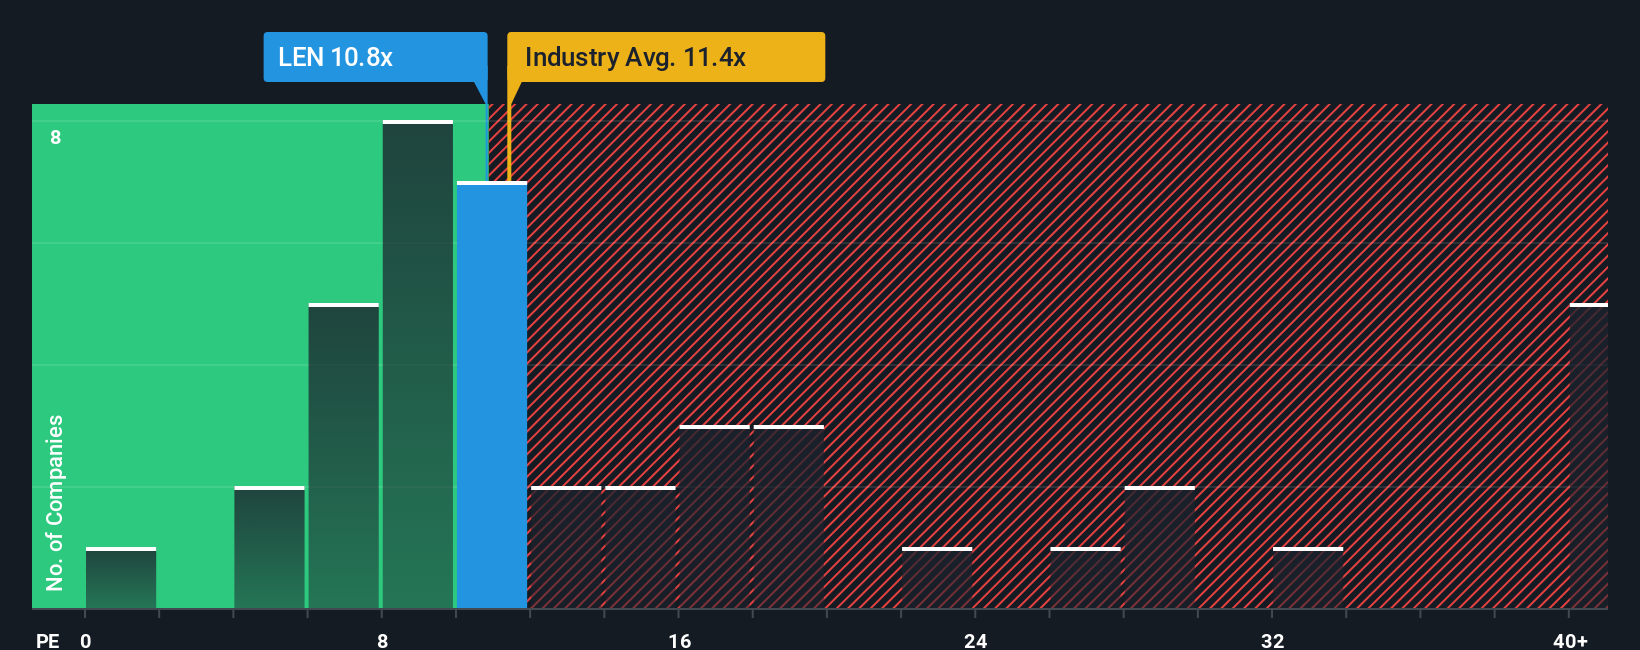
Upgrade Your Decision Making: Choose your Lennar Narrative
Beyond traditional valuation ratios, Narratives offer a dynamic way to invest by connecting the story you believe about a company to specific financial forecasts and a calculated fair value. A Narrative lets you describe how you see Lennar’s future, such as expected revenues, earnings growth, and profit margins, and translates your perspective into a forecast and valuation reflecting your assumptions.
On Simply Wall St, Narratives are an easy tool that millions of investors use to create, share, and compare different investment perspectives. They help you decide when to buy or sell by directly comparing your calculated Fair Value to the current market price. This approach makes your decision process both personal and evidence-based.
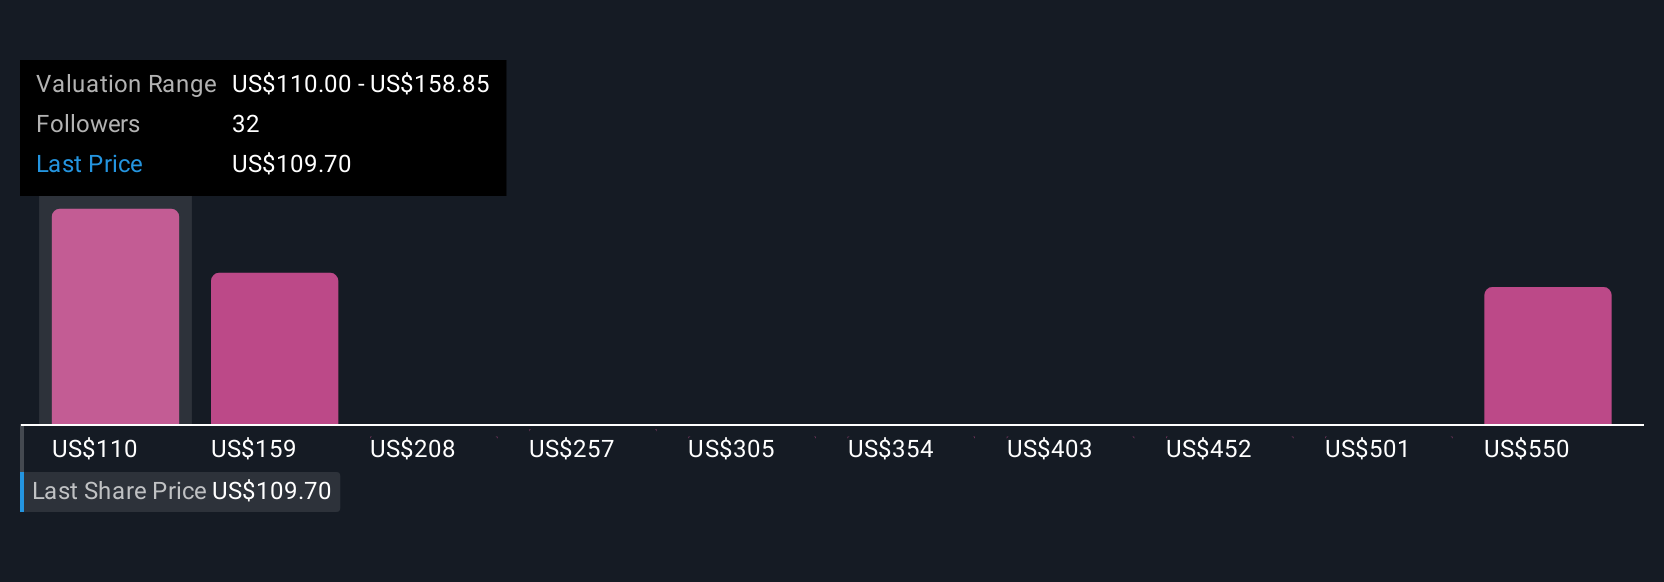
Narratives are constantly updated when fresh news or earnings are reported, keeping your assessment relevant without extra effort. For Lennar, one user’s Narrative might see stable earnings growth supporting a price target of $215. Another might expect industry challenges to justify a more cautious outlook with a $95 valuation. This demonstrates how the same company can inspire different, data-driven investment stories.
For Lennar, we’ll make it easy for you with previews of two leading Lennar Narratives:
Fair Value: $162.49
Current Price vs. Fair Value: 17.33% undervalued
Revenue Growth Rate: 5.67%
- Projects a mild near-term gain and significant long-term upside as earnings grow and profit margins remain robust. Offers a 1-year price target of $149.57 and a 3-year target of $215.56.
- Views current homebuilding challenges as short-term and anticipates a strong demand recovery once mortgage rates stabilize and positive policy changes are enacted.
- Highlights Lennar’s competitive advantage in high-growth regions such as Texas, along with ongoing structural housing shortages in the U.S., as long-term growth catalysts.
Fair Value: $121.43
Current Price vs. Fair Value: 10.56% overvalued
Revenue Growth Rate: 4.41%
- Anticipates margin pressure and slower earnings growth as Lennar shifts to an asset-light model and faces a challenging market with higher mortgage rates and softer demand.
- Notes that the company’s continued focus on acquisitions, such as Rausch Coleman, and operational efficiency may support revenue, but expects reduced profitability and narrowing margins over the next few years.
- Most analysts view the stock as fairly valued or slightly overvalued at current levels and caution that higher returns will depend on significant improvements in margins or broader market conditions.
This article by Simply Wall St is general in nature. We provide commentary based on historical data and analyst forecasts only using an unbiased methodology and our articles are not intended to be financial advice. It does not constitute a recommendation to buy or sell any stock, and does not take account of your objectives, or your financial situation. We aim to bring you long-term focused analysis driven by fundamental data. Note that our analysis may not factor in the latest price-sensitive company announcements or qualitative material. Simply Wall St has no position in any stocks mentioned.
New: AI Stock Screener & Alerts
Our new AI Stock Screener scans the market every day to uncover opportunities.
• Dividend Powerhouses (3%+ Yield)
• Undervalued Small Caps with Insider Buying
• High growth Tech and AI Companies
Or build your own from over 50 metrics.
Have feedback on this article? Concerned about the content? Get in touch with us directly. Alternatively, email editorial-team@simplywallst.com
About NYSE:LEN
Lennar
Operates as a homebuilder primarily under the Lennar brand in the United States.
Excellent balance sheet average dividend payer.
Similar Companies
Market Insights


Advertisement
Community Narratives
100% Patient Improvement in trial puts this $16M Biotech on the radar
Fair Value US$5.30|75.8% undervalued
JO
Community Contributor
PayPal's Future Growth Through Venmo and Merchant Solutions
Fair Value US$105.25|34.2% undervalued
ZW
Community Contributor
IREN's Bold Moves in Sustainable Bitcoin Mining & AI Data Centers
Fair Value US$26.54|9.7% overvalued
BL
Community Contributor