
Advertisement
- United States
- /
- Leisure
- /
- NasdaqGS:SWIM
We Think Latham Group (NASDAQ:SWIM) Is Taking Some Risk With Its Debt
David Iben put it well when he said, 'Volatility is not a risk we care about. What we care about is avoiding the permanent loss of capital.' So it might be obvious that you need to consider debt, when you think about how risky any given stock is, because too much debt can sink a company. We note that Latham Group, Inc. (NASDAQ:SWIM) does have debt on its balance sheet. But should shareholders be worried about its use of debt?
Why Does Debt Bring Risk?
Debt is a tool to help businesses grow, but if a business is incapable of paying off its lenders, then it exists at their mercy. Part and parcel of capitalism is the process of 'creative destruction' where failed businesses are mercilessly liquidated by their bankers. While that is not too common, we often do see indebted companies permanently diluting shareholders because lenders force them to raise capital at a distressed price. By replacing dilution, though, debt can be an extremely good tool for businesses that need capital to invest in growth at high rates of return. The first step when considering a company's debt levels is to consider its cash and debt together.
How Much Debt Does Latham Group Carry?
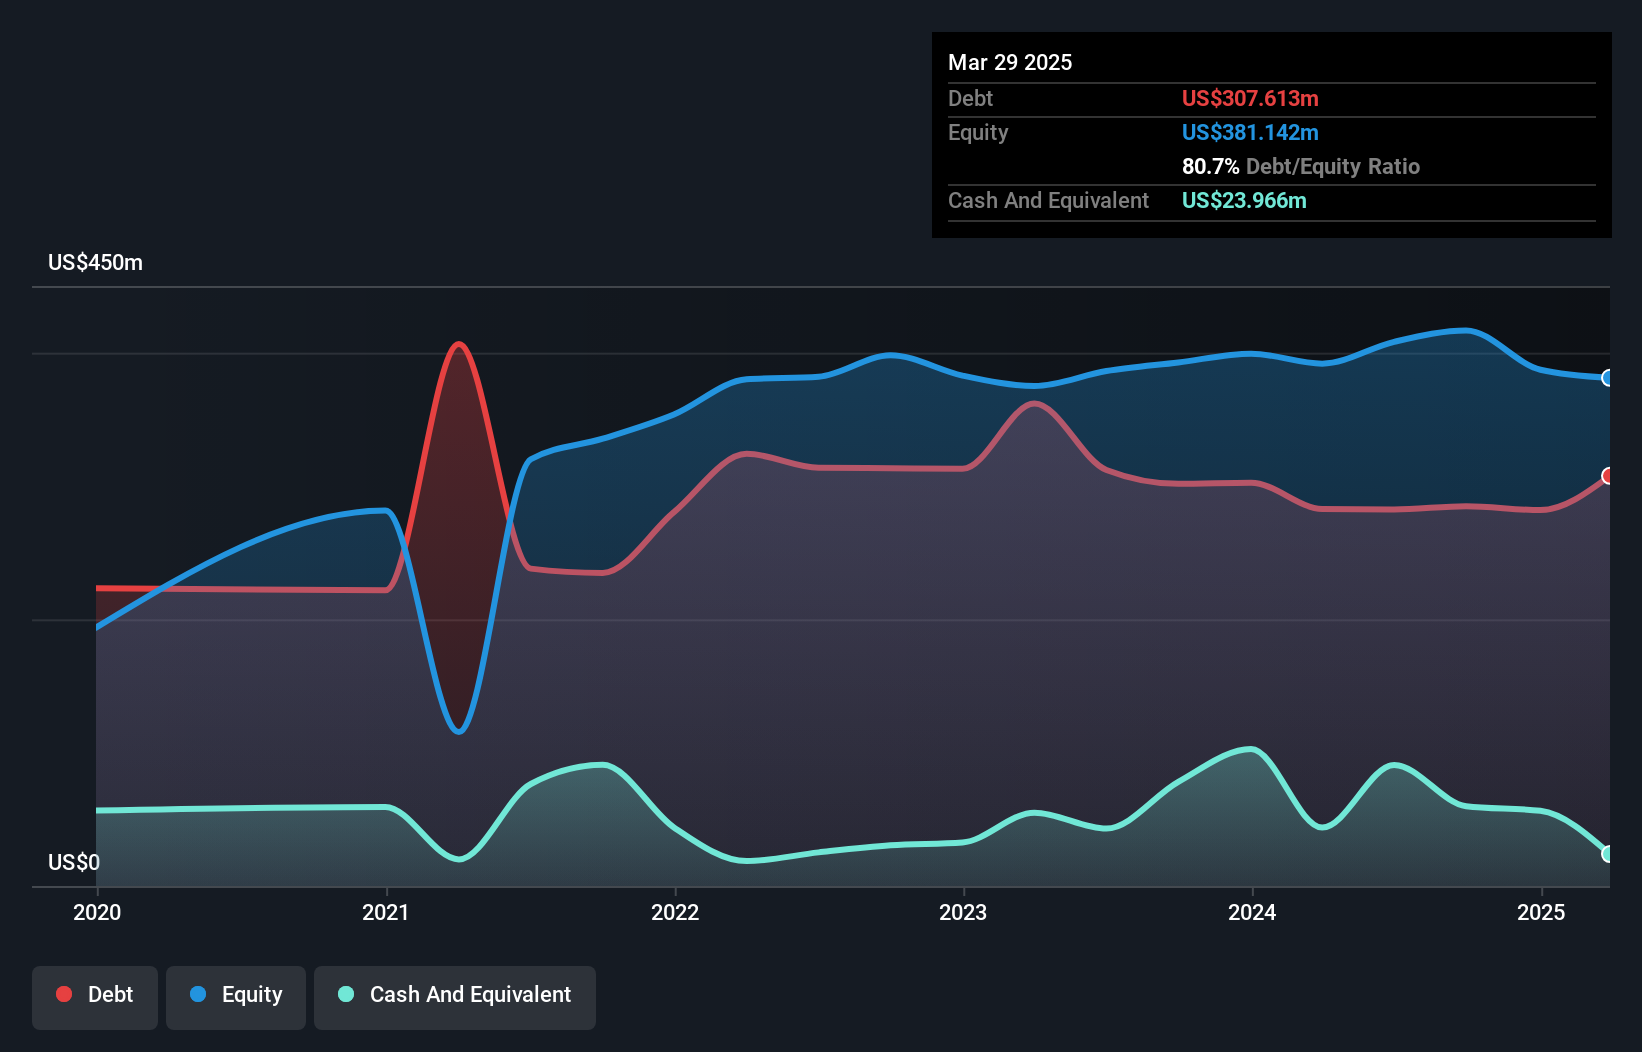
You can click the graphic below for the historical numbers, but it shows that as of March 2025 Latham Group had US$307.6m of debt, an increase on US$282.8m, over one year. However, it also had US$24.0m in cash, and so its net debt is US$283.6m.
How Strong Is Latham Group's Balance Sheet?
We can see from the most recent balance sheet that Latham Group had liabilities of US$83.0m falling due within a year, and liabilities of US$360.4m due beyond that. Offsetting this, it had US$24.0m in cash and US$92.3m in receivables that were due within 12 months. So its liabilities outweigh the sum of its cash and (near-term) receivables by US$327.1m.
Latham Group has a market capitalization of US$747.1m, so it could very likely raise cash to ameliorate its balance sheet, if the need arose. However, it is still worthwhile taking a close look at its ability to pay off debt.
Check out our latest analysis for Latham Group
We use two main ratios to inform us about debt levels relative to earnings. The first is net debt divided by earnings before interest, tax, depreciation, and amortization (EBITDA), while the second is how many times its earnings before interest and tax (EBIT) covers its interest expense (or its interest cover, for short). The advantage of this approach is that we take into account both the absolute quantum of debt (with net debt to EBITDA) and the actual interest expenses associated with that debt (with its interest cover ratio).
While we wouldn't worry about Latham Group's net debt to EBITDA ratio of 4.6, we think its super-low interest cover of 0.59 times is a sign of high leverage. In large part that's due to the company's significant depreciation and amortisation charges, which arguably mean its EBITDA is a very generous measure of earnings, and its debt may be more of a burden than it first appears. So shareholders should probably be aware that interest expenses appear to have really impacted the business lately. Even worse, Latham Group saw its EBIT tank 24% over the last 12 months. If earnings continue to follow that trajectory, paying off that debt load will be harder than convincing us to run a marathon in the rain. There's no doubt that we learn most about debt from the balance sheet. But ultimately the future profitability of the business will decide if Latham Group can strengthen its balance sheet over time. So if you want to see what the professionals think, you might find this free report on analyst profit forecasts to be interesting.
Finally, a company can only pay off debt with cold hard cash, not accounting profits. So the logical step is to look at the proportion of that EBIT that is matched by actual free cash flow. Over the last three years, Latham Group actually produced more free cash flow than EBIT. That sort of strong cash conversion gets us as excited as the crowd when the beat drops at a Daft Punk concert.
Our View
On the face of it, Latham Group's interest cover left us tentative about the stock, and its EBIT growth rate was no more enticing than the one empty restaurant on the busiest night of the year. But at least it's pretty decent at converting EBIT to free cash flow; that's encouraging. Looking at the balance sheet and taking into account all these factors, we do believe that debt is making Latham Group stock a bit risky. Some people like that sort of risk, but we're mindful of the potential pitfalls, so we'd probably prefer it carry less debt. There's no doubt that we learn most about debt from the balance sheet. But ultimately, every company can contain risks that exist outside of the balance sheet. We've identified 1 warning sign with Latham Group , and understanding them should be part of your investment process.
Of course, if you're the type of investor who prefers buying stocks without the burden of debt, then don't hesitate to discover our exclusive list of net cash growth stocks, today.
New: AI Stock Screener & Alerts
Our new AI Stock Screener scans the market every day to uncover opportunities.
• Dividend Powerhouses (3%+ Yield)
• Undervalued Small Caps with Insider Buying
• High growth Tech and AI Companies
Or build your own from over 50 metrics.
Have feedback on this article? Concerned about the content? Get in touch with us directly. Alternatively, email editorial-team (at) simplywallst.com.
This article by Simply Wall St is general in nature. We provide commentary based on historical data and analyst forecasts only using an unbiased methodology and our articles are not intended to be financial advice. It does not constitute a recommendation to buy or sell any stock, and does not take account of your objectives, or your financial situation. We aim to bring you long-term focused analysis driven by fundamental data. Note that our analysis may not factor in the latest price-sensitive company announcements or qualitative material. Simply Wall St has no position in any stocks mentioned.
About NasdaqGS:SWIM
Latham Group
Designs, manufactures, and markets in-ground residential swimming pools in North America, Australia, and New Zealand.
Adequate balance sheet with moderate growth potential.
Market Insights

Advertisement
Community Narratives
A formidable player in AI and enterprise computing.
Fair Value US$210.00|12.2% overvalued
CO
Community Contributor
IREN's Bold Moves in Sustainable Bitcoin Mining & AI Data Centers
Fair Value US$72.52|17.1% undervalued
BL
Community Contributor
Cooling the Champions: The Aussie Tech Behind F1's Victories
Fair Value AU$12.40|38.7% undervalued
TR
Community Contributor