Advertisement
- United States
- /
- Leisure
- /
- NasdaqGS:PTON
Is Peloton Interactive (PTON) Pricing Reflect Its Repositioning Efforts After Prolonged Share Price Slide

Reviewed by Bailey Pemberton
- If you are wondering whether Peloton Interactive's current share price reflects its true worth, this article will walk through what the numbers are saying about the stock today.
- The share price recently closed at US$4.25, with returns of a 3.4% decline over 7 days, a 32.9% decline over 30 days, a 30.6% decline year to date, a 56.5% decline over 1 year, a 68.8% decline over 3 years and a 96.6% decline over 5 years. These performance figures may shape how investors think about potential risk and reward.
- Recent coverage around Peloton Interactive has focused on its ongoing efforts to reposition the business and respond to changing demand for connected fitness equipment and subscription services. These developments help frame why the stock has seen such large moves over multiple time frames and why valuation has become such a central question for investors.
- Peloton Interactive currently has a valuation score of 5/6, based on how many of six checks suggest the shares may be undervalued. Next, we will look at what traditional valuation methods say about that score before finishing with a more complete way to think about what the stock could be worth.
Find out why Peloton Interactive's -56.5% return over the last year is lagging behind its peers.
Approach 1: Peloton Interactive Discounted Cash Flow (DCF) Analysis
A Discounted Cash Flow, or DCF, model estimates what a company might be worth by projecting its future cash flows and then discounting those back to today’s value using a required return. It is essentially asking what those future dollars are worth in your hand right now.
For Peloton Interactive, the model used is a 2 Stage Free Cash Flow to Equity approach based on cash flow projections. The latest twelve month Free Cash Flow is about $336.5 million. Analyst forecasts and subsequent extrapolations point to Free Cash Flow of around $409.9 million in 2030, with a series of annual projections between now and 2035 that Simply Wall St has discounted back to today using its standard assumptions.
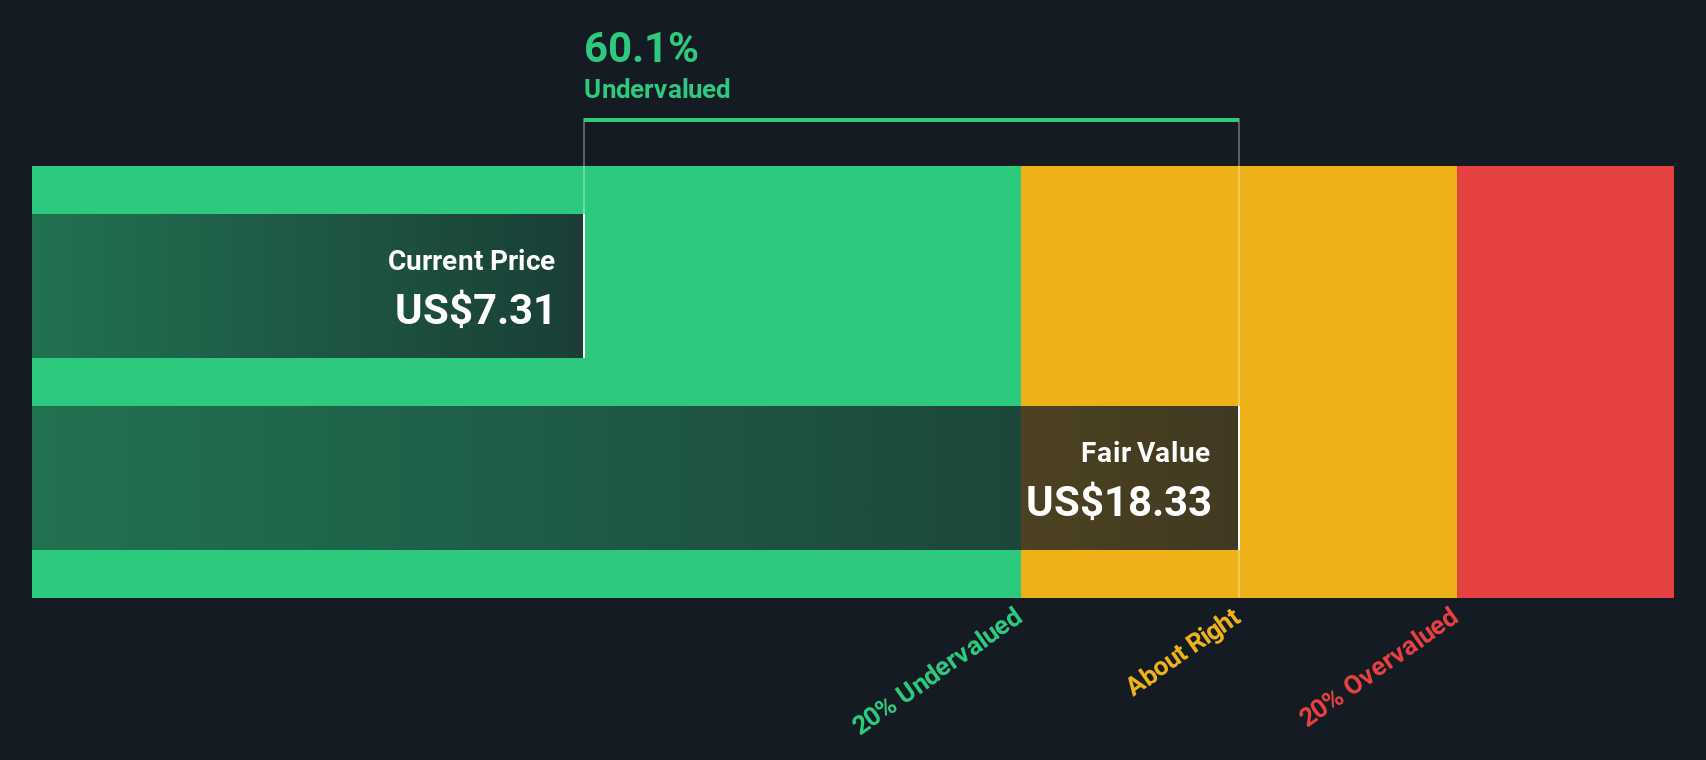
Putting those discounted cash flows together gives an estimated intrinsic value of about $14.33 per share, compared with the recent market price of $4.25. That gap implies the shares are trading at a 70.3% discount to this DCF estimate, which is a wide margin between modelled value and where the market is currently pricing the stock.
Result: UNDERVALUED
Our Discounted Cash Flow (DCF) analysis suggests Peloton Interactive is undervalued by 70.3%. Track this in your watchlist or portfolio, or discover 54 more high quality undervalued stocks.
Approach 2: Peloton Interactive Price vs Sales
For companies where earnings can be less consistent or even negative, the P/S ratio is often a useful way to think about value, because it focuses on how the market is pricing each dollar of revenue rather than profits that can swing around.
In general, higher growth expectations and lower perceived risk tend to support a higher “normal” or “fair” trading multiple. Slower expected growth or higher risk usually point to a lower multiple being reasonable.
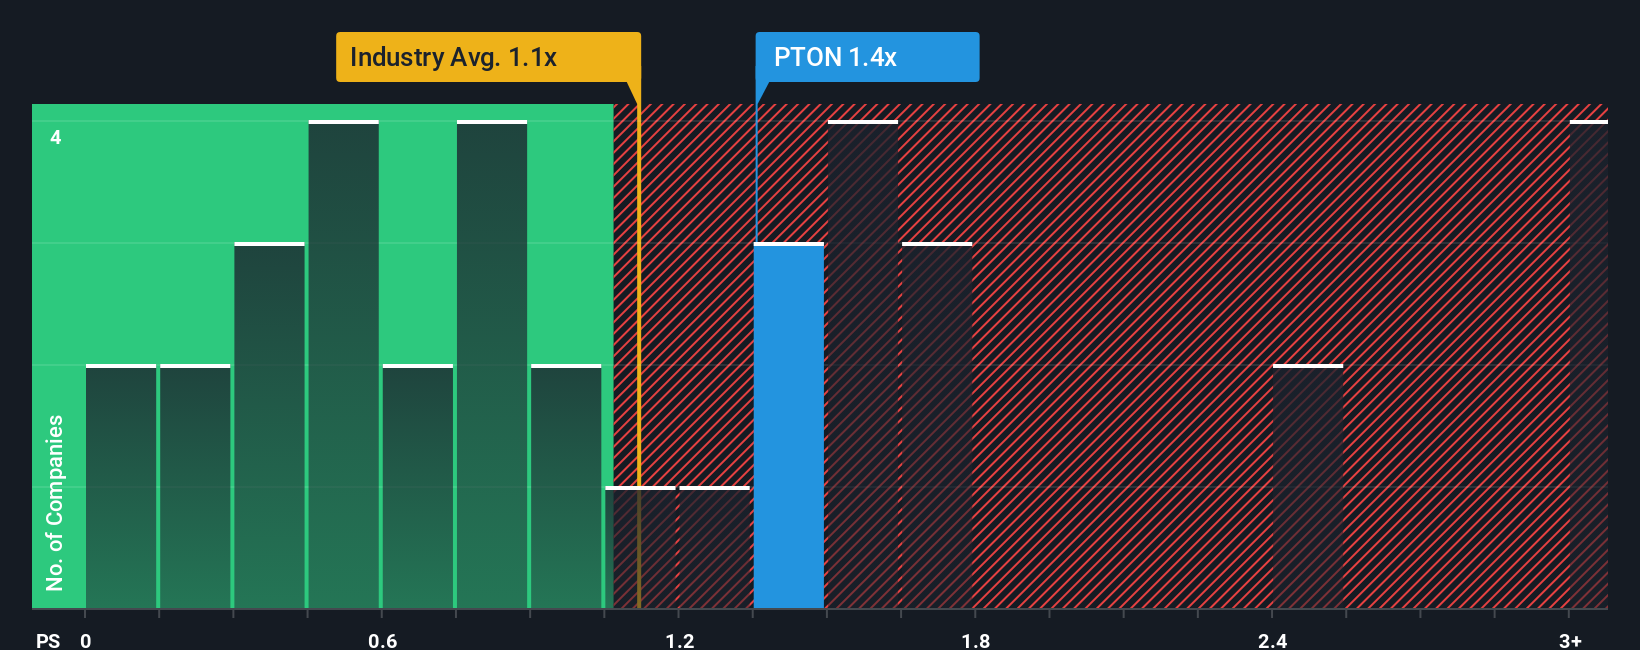
Peloton Interactive is currently trading on a P/S ratio of 0.74x. That sits below the Leisure industry average of 0.96x and also below the peer average of 1.28x. Simply Wall St’s Fair Ratio for Peloton, which is 0.92x, aims to estimate what a more appropriate P/S could be after factoring in elements such as the company’s earnings profile, industry, profit margin, market value and key risks.
This Fair Ratio can be more informative than a simple comparison with peers or the sector, because it attempts to adjust for differences in growth expectations, risk, profitability, size and industry characteristics. Set against Peloton’s current 0.74x P/S, the 0.92x Fair Ratio points to the shares trading below that modelled level.
Result: UNDERVALUED
P/S ratios tell one story, but what if the real opportunity lies elsewhere? Start investing in legacies, not executives. Discover our 23 top founder-led companies.
Upgrade Your Decision Making: Choose your Peloton Interactive Narrative
Earlier we mentioned that there is an even better way to think about valuation. This is where Narratives come in, letting you attach a clear story about Peloton Interactive to your numbers, from your assumed fair value through to your estimates for future revenue, earnings and margins.
On Simply Wall St, Narratives live in the Community page and give you a simple framework that ties the company story you believe to a financial forecast and then to a fair value. You can then easily compare that fair value against the current share price to decide whether Peloton looks attractive, fully priced or expensive to you.
Narratives are also refreshed when new information appears, such as earnings, guidance or news. This means your Peloton view does not stay static, and you can quickly see whether fresh data supports or challenges the story you had in mind.
For example, one Peloton Narrative might line up with a fair value of about US$6 based on more cautious assumptions, while another points closer to US$16.64 under more optimistic expectations. Seeing those side by side helps you decide which story, and which set of numbers, feels closest to how you see the company.
Do you think there's more to the story for Peloton Interactive? Head over to our Community to see what others are saying!

This article by Simply Wall St is general in nature. We provide commentary based on historical data and analyst forecasts only using an unbiased methodology and our articles are not intended to be financial advice. It does not constitute a recommendation to buy or sell any stock, and does not take account of your objectives, or your financial situation. We aim to bring you long-term focused analysis driven by fundamental data. Note that our analysis may not factor in the latest price-sensitive company announcements or qualitative material. Simply Wall St has no position in any stocks mentioned.
New: Manage All Your Stock Portfolios in One Place
We've created the ultimate portfolio companion for stock investors, and it's free.
• Connect an unlimited number of Portfolios and see your total in one currency
• Be alerted to new Warning Signs or Risks via email or mobile
• Track the Fair Value of your stocks
Have feedback on this article? Concerned about the content? Get in touch with us directly. Alternatively, email editorial-team@simplywallst.com
About NasdaqGS:PTON
Peloton Interactive
Provides fitness and wellness products and services in North America and internationally.
Reasonable growth potential with low risk.
Similar Companies
Market Insights


Advertisement
Weekly Picks
RI


Rick_Orford on Upside Gold ·
This OVERLOOKED Gold Stock Could TRIPLE - 3.3M Ounces, Bottom-of-Peer Valuation
Fair Value:CA$467.8% undervalued
10 followersusers have followed this narrative
0 commentsusers have commented on this narrative
1 likeusers have liked this narrative
CL


Clive_Thompson on Take-Two Interactive Software ·
Take-Two Interactive: The Calm Before the Storm NASDAQ: TTWO Last Price: $242.41 Date: May 15, 2026
Fair Value:US$276.9721.1% undervalued
44 followersusers have followed this narrative
0 commentsusers have commented on this narrative
10 likesusers have liked this narrative
NI


niteco on Honeywell International ·
Honeywell - The Demand-Side of the AI Infrastructure
Fair Value:US$320.1927.7% undervalued
33 followersusers have followed this narrative
0 commentsusers have commented on this narrative
13 likesusers have liked this narrative
BJ


Bjergby on PagSeguro Digital ·
PagSeguro: A Cheap Bet on a Bank Hiding Inside a Payments Company, Priced for Failure
Fair Value:US$19.251.7% undervalued
14 followersusers have followed this narrative
0 commentsusers have commented on this narrative
3 likesusers have liked this narrative
Recently Updated Narratives
WO


woodworthfund on Willamette Valley Vineyards ·
Willamette Valley Vineyards (WVVI): Not-So-Great Value
Fair Value:US$0.21.2k% overvalued
12 followersusers have followed this narrative
0 commentsusers have commented on this narrative
0 likesusers have liked this narrative
DE


Delphic on NuScale Power ·
NuScale is Postioned For Long-Term Growth
Fair Value:US$10087.9% undervalued
2 followersusers have followed this narrative
0 commentsusers have commented on this narrative
0 likesusers have liked this narrative
RO


RockeTeller on Argenta Silver ·
Frank Giustra Backed: The High-Grade Silver Project Acquired for Just $3.5M Could Deliver 30x Silver Torque
Fair Value:CA$40.3598.7% undervalued
14 followersusers have followed this narrative
9 commentsusers have commented on this narrative
1 likeusers have liked this narrative
Popular Narratives
GO

GoldenSands on QuantumScape ·
QuantumScape: A Mispriced Deep‑Tech Inflection Point With Multi‑Billion‑Dollar Optionality
Fair Value:US$8589.3% undervalued
116 followersusers have followed this narrative
2 commentsusers have commented on this narrative
33 likesusers have liked this narrative
CL
Clive_Thompson on Take-Two Interactive Software ·
Take-Two Interactive: The Calm Before the Storm NASDAQ: TTWO Last Price: $242.41 Date: May 15, 2026
Fair Value:US$276.9721.1% undervalued
44 followersusers have followed this narrative
0 commentsusers have commented on this narrative
10 likesusers have liked this narrative
TR


tripledub on lululemon athletica ·
Lululemon Got Boring Right About the Time It Got Cheap. That's Usually the Point
Fair Value:US$22040.4% undervalued
26 followersusers have followed this narrative
6 commentsusers have commented on this narrative
32 likesusers have liked this narrative


