
Advertisement
- United States
- /
- Commercial Services
- /
- NYSE:ROL
Rollins' (NYSE:ROL) five-year earnings growth trails the 18% YoY shareholder returns

When you buy a stock there is always a possibility that it could drop 100%. But when you pick a company that is really flourishing, you can make more than 100%. One great example is Rollins, Inc. (NYSE:ROL) which saw its share price drive 115% higher over five years. On top of that, the share price is up 11% in about a quarter.
After a strong gain in the past week, it's worth seeing if longer term returns have been driven by improving fundamentals.
We check all companies for important risks. See what we found for Rollins in our free report.There is no denying that markets are sometimes efficient, but prices do not always reflect underlying business performance. One imperfect but simple way to consider how the market perception of a company has shifted is to compare the change in the earnings per share (EPS) with the share price movement.
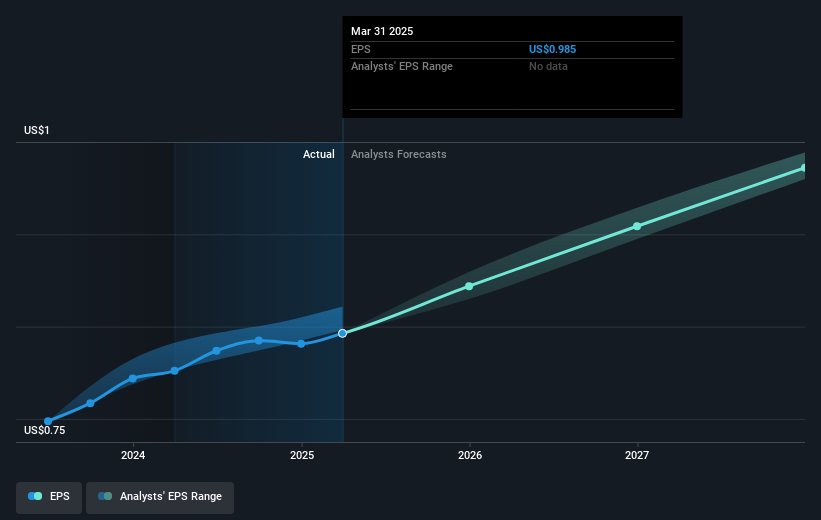
During five years of share price growth, Rollins achieved compound earnings per share (EPS) growth of 19% per year. This EPS growth is reasonably close to the 17% average annual increase in the share price. This indicates that investor sentiment towards the company has not changed a great deal. Rather, the share price has approximately tracked EPS growth.
You can see below how EPS has changed over time (discover the exact values by clicking on the image).
It's probably worth noting that the CEO is paid less than the median at similar sized companies. It's always worth keeping an eye on CEO pay, but a more important question is whether the company will grow earnings throughout the years. Before buying or selling a stock, we always recommend a close examination of historic growth trends, available here..
What About Dividends?
When looking at investment returns, it is important to consider the difference between total shareholder return (TSR) and share price return. The TSR is a return calculation that accounts for the value of cash dividends (assuming that any dividend received was reinvested) and the calculated value of any discounted capital raisings and spin-offs. Arguably, the TSR gives a more comprehensive picture of the return generated by a stock. In the case of Rollins, it has a TSR of 129% for the last 5 years. That exceeds its share price return that we previously mentioned. This is largely a result of its dividend payments!
A Different Perspective
It's nice to see that Rollins shareholders have received a total shareholder return of 25% over the last year. Of course, that includes the dividend. That's better than the annualised return of 18% over half a decade, implying that the company is doing better recently. In the best case scenario, this may hint at some real business momentum, implying that now could be a great time to delve deeper. Before spending more time on Rollins it might be wise to click here to see if insiders have been buying or selling shares.
Of course, you might find a fantastic investment by looking elsewhere. So take a peek at this free list of companies we expect will grow earnings.
Please note, the market returns quoted in this article reflect the market weighted average returns of stocks that currently trade on American exchanges.
New: AI Stock Screener & Alerts
Our new AI Stock Screener scans the market every day to uncover opportunities.
• Dividend Powerhouses (3%+ Yield)
• Undervalued Small Caps with Insider Buying
• High growth Tech and AI Companies
Or build your own from over 50 metrics.
Have feedback on this article? Concerned about the content? Get in touch with us directly. Alternatively, email editorial-team (at) simplywallst.com.
This article by Simply Wall St is general in nature. We provide commentary based on historical data and analyst forecasts only using an unbiased methodology and our articles are not intended to be financial advice. It does not constitute a recommendation to buy or sell any stock, and does not take account of your objectives, or your financial situation. We aim to bring you long-term focused analysis driven by fundamental data. Note that our analysis may not factor in the latest price-sensitive company announcements or qualitative material. Simply Wall St has no position in any stocks mentioned.
About NYSE:ROL
Rollins
Through its subsidiaries, provides pest and wildlife control services to residential and commercial customers in the United States and internationally.
Proven track record with adequate balance sheet.
Similar Companies
Market Insights

Advertisement
Community Narratives
MicroStrategy: Volatile Gamble or Golden Opportunity?
Fair Value US$663.00|31.9% undervalued
BL
Community Contributor
Emerging Markets and Debt Reduction Will Propel Bath & Body Works Forward
Fair Value US$40.73|22.1% undervalued
ZW
Community Contributor
An amazing opportunity to potentially get a 100 bagger
Fair Value US$10.00|36.0% overvalued
DA
Community Contributor