Genpact (NYSE:G) shareholders have earned a 57% return over the last year


Passive investing in index funds can generate returns that roughly match the overall market. But one can do better than that by picking better than average stocks (as part of a diversified portfolio). To wit, the Genpact Limited (NYSE:G) share price is 55% higher than it was a year ago, much better than the market return of around 7.5% (not including dividends) in the same period. So that should have shareholders smiling. Having said that, the longer term returns aren't so impressive, with stock gaining just 21% in three years.
So let's investigate and see if the longer term performance of the company has been in line with the underlying business' progress.
We've discovered 1 warning sign about Genpact. View them for free.While markets are a powerful pricing mechanism, share prices reflect investor sentiment, not just underlying business performance. One imperfect but simple way to consider how the market perception of a company has shifted is to compare the change in the earnings per share (EPS) with the share price movement.
Over the last twelve months, Genpact actually shrank its EPS by 17%.
Given the share price gain, we doubt the market is measuring progress with EPS. Since the change in EPS doesn't seem to correlate with the change in share price, it's worth taking a look at other metrics.
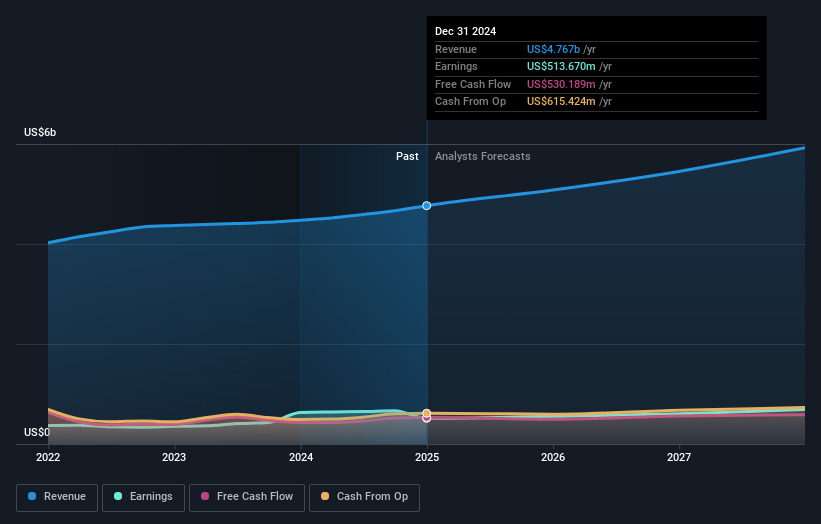
We are skeptical of the suggestion that the 1.4% dividend yield would entice buyers to the stock. However the year on year revenue growth of 6.5% would help. Many businesses do go through a phase where they have to forgo some profits to drive business development, and sometimes its for the best.
You can see how earnings and revenue have changed over time in the image below (click on the chart to see the exact values).
Genpact is well known by investors, and plenty of clever analysts have tried to predict the future profit levels. So we recommend checking out this free report showing consensus forecasts
What About Dividends?
When looking at investment returns, it is important to consider the difference between total shareholder return (TSR) and share price return. The TSR incorporates the value of any spin-offs or discounted capital raisings, along with any dividends, based on the assumption that the dividends are reinvested. So for companies that pay a generous dividend, the TSR is often a lot higher than the share price return. In the case of Genpact, it has a TSR of 57% for the last 1 year. That exceeds its share price return that we previously mentioned. And there's no prize for guessing that the dividend payments largely explain the divergence!
A Different Perspective
It's good to see that Genpact has rewarded shareholders with a total shareholder return of 57% in the last twelve months. Of course, that includes the dividend. That's better than the annualised return of 8% over half a decade, implying that the company is doing better recently. Given the share price momentum remains strong, it might be worth taking a closer look at the stock, lest you miss an opportunity. It's always interesting to track share price performance over the longer term. But to understand Genpact better, we need to consider many other factors. For instance, we've identified 1 warning sign for Genpact that you should be aware of.
But note: Genpact may not be the best stock to buy. So take a peek at this free list of interesting companies with past earnings growth (and further growth forecast).
Please note, the market returns quoted in this article reflect the market weighted average returns of stocks that currently trade on American exchanges.
If you're looking to trade Genpact, open an account with the lowest-cost platform trusted by professionals, Interactive Brokers.
With clients in over 200 countries and territories, and access to 160 markets, IBKR lets you trade stocks, options, futures, forex, bonds and funds from a single integrated account.
Enjoy no hidden fees, no account minimums, and FX conversion rates as low as 0.03%, far better than what most brokers offer.
Sponsored ContentNew: Manage All Your Stock Portfolios in One Place
We've created the ultimate portfolio companion for stock investors, and it's free.
• Connect an unlimited number of Portfolios and see your total in one currency
• Be alerted to new Warning Signs or Risks via email or mobile
• Track the Fair Value of your stocks
Have feedback on this article? Concerned about the content? Get in touch with us directly. Alternatively, email editorial-team (at) simplywallst.com.
This article by Simply Wall St is general in nature. We provide commentary based on historical data and analyst forecasts only using an unbiased methodology and our articles are not intended to be financial advice. It does not constitute a recommendation to buy or sell any stock, and does not take account of your objectives, or your financial situation. We aim to bring you long-term focused analysis driven by fundamental data. Note that our analysis may not factor in the latest price-sensitive company announcements or qualitative material. Simply Wall St has no position in any stocks mentioned.
About NYSE:G
Genpact
Provides business process outsourcing and information technology services in India, rest of Asia, North and Latin America, and Europe.
Flawless balance sheet and undervalued.
Similar Companies
Market Insights

Community Narratives
