- United States
- /
- Professional Services
- /
- NYSE:DNB
Does Dun & Bradstreet Holdings (NYSE:DNB) Have A Healthy Balance Sheet?


Some say volatility, rather than debt, is the best way to think about risk as an investor, but Warren Buffett famously said that 'Volatility is far from synonymous with risk.' So it might be obvious that you need to consider debt, when you think about how risky any given stock is, because too much debt can sink a company. We note that Dun & Bradstreet Holdings, Inc. (NYSE:DNB) does have debt on its balance sheet. But is this debt a concern to shareholders?
When Is Debt Dangerous?
Debt and other liabilities become risky for a business when it cannot easily fulfill those obligations, either with free cash flow or by raising capital at an attractive price. If things get really bad, the lenders can take control of the business. However, a more frequent (but still costly) occurrence is where a company must issue shares at bargain-basement prices, permanently diluting shareholders, just to shore up its balance sheet. Of course, the upside of debt is that it often represents cheap capital, especially when it replaces dilution in a company with the ability to reinvest at high rates of return. When we examine debt levels, we first consider both cash and debt levels, together.
Check out our latest analysis for Dun & Bradstreet Holdings
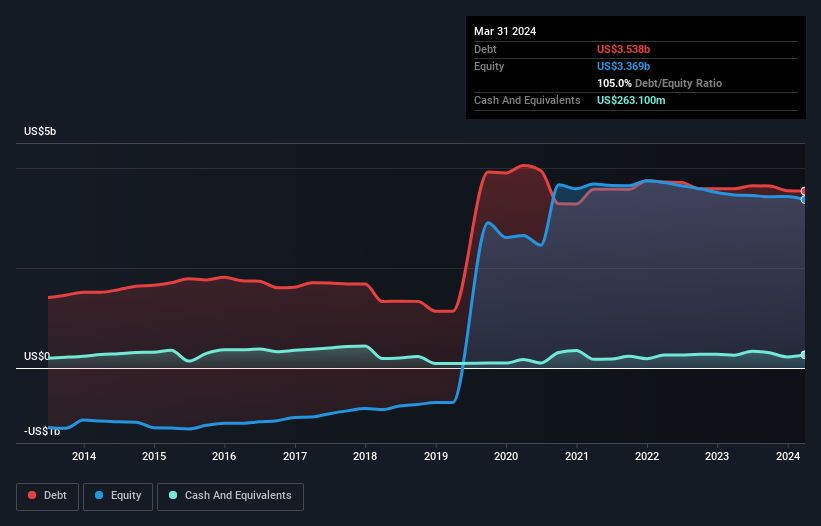
What Is Dun & Bradstreet Holdings's Debt?
The chart below, which you can click on for greater detail, shows that Dun & Bradstreet Holdings had US$3.54b in debt in March 2024; about the same as the year before. On the flip side, it has US$263.1m in cash leading to net debt of about US$3.27b.
A Look At Dun & Bradstreet Holdings' Liabilities
According to the last reported balance sheet, Dun & Bradstreet Holdings had liabilities of US$987.4m due within 12 months, and liabilities of US$4.62b due beyond 12 months. Offsetting this, it had US$263.1m in cash and US$178.7m in receivables that were due within 12 months. So its liabilities outweigh the sum of its cash and (near-term) receivables by US$5.17b.
Given this deficit is actually higher than the company's market capitalization of US$4.23b, we think shareholders really should watch Dun & Bradstreet Holdings's debt levels, like a parent watching their child ride a bike for the first time. Hypothetically, extremely heavy dilution would be required if the company were forced to pay down its liabilities by raising capital at the current share price.
In order to size up a company's debt relative to its earnings, we calculate its net debt divided by its earnings before interest, tax, depreciation, and amortization (EBITDA) and its earnings before interest and tax (EBIT) divided by its interest expense (its interest cover). The advantage of this approach is that we take into account both the absolute quantum of debt (with net debt to EBITDA) and the actual interest expenses associated with that debt (with its interest cover ratio).
Weak interest cover of 0.73 times and a disturbingly high net debt to EBITDA ratio of 5.4 hit our confidence in Dun & Bradstreet Holdings like a one-two punch to the gut. The debt burden here is substantial. More concerning, Dun & Bradstreet Holdings saw its EBIT drop by 8.5% in the last twelve months. If it keeps going like that paying off its debt will be like running on a treadmill -- a lot of effort for not much advancement. The balance sheet is clearly the area to focus on when you are analysing debt. But it is future earnings, more than anything, that will determine Dun & Bradstreet Holdings's ability to maintain a healthy balance sheet going forward. So if you want to see what the professionals think, you might find this free report on analyst profit forecasts to be interesting.
But our final consideration is also important, because a company cannot pay debt with paper profits; it needs cold hard cash. So we clearly need to look at whether that EBIT is leading to corresponding free cash flow. Happily for any shareholders, Dun & Bradstreet Holdings actually produced more free cash flow than EBIT over the last three years. There's nothing better than incoming cash when it comes to staying in your lenders' good graces.
Our View
On the face of it, Dun & Bradstreet Holdings's net debt to EBITDA left us tentative about the stock, and its interest cover was no more enticing than the one empty restaurant on the busiest night of the year. But at least it's pretty decent at converting EBIT to free cash flow; that's encouraging. Looking at the bigger picture, it seems clear to us that Dun & Bradstreet Holdings's use of debt is creating risks for the company. If everything goes well that may pay off but the downside of this debt is a greater risk of permanent losses. There's no doubt that we learn most about debt from the balance sheet. However, not all investment risk resides within the balance sheet - far from it. For example Dun & Bradstreet Holdings has 2 warning signs (and 1 which is a bit concerning) we think you should know about.
Of course, if you're the type of investor who prefers buying stocks without the burden of debt, then don't hesitate to discover our exclusive list of net cash growth stocks, today.
New: Manage All Your Stock Portfolios in One Place
We've created the ultimate portfolio companion for stock investors, and it's free.
• Connect an unlimited number of Portfolios and see your total in one currency
• Be alerted to new Warning Signs or Risks via email or mobile
• Track the Fair Value of your stocks
Have feedback on this article? Concerned about the content? Get in touch with us directly. Alternatively, email editorial-team (at) simplywallst.com.
This article by Simply Wall St is general in nature. We provide commentary based on historical data and analyst forecasts only using an unbiased methodology and our articles are not intended to be financial advice. It does not constitute a recommendation to buy or sell any stock, and does not take account of your objectives, or your financial situation. We aim to bring you long-term focused analysis driven by fundamental data. Note that our analysis may not factor in the latest price-sensitive company announcements or qualitative material. Simply Wall St has no position in any stocks mentioned.
About NYSE:DNB
Dun & Bradstreet Holdings
Provides business-to-business data and analytics in North America and internationally.
Good value with moderate growth potential.
Similar Companies
Market Insights

Community Narratives
