- United States
- /
- Professional Services
- /
- NasdaqGS:SAIC
Investors in Science Applications International (NASDAQ:SAIC) have seen respectable returns of 55% over the past five years


While Science Applications International Corporation (NASDAQ:SAIC) shareholders are probably generally happy, the stock hasn't had particularly good run recently, with the share price falling 15% in the last quarter. But the silver lining is the stock is up over five years. However we are not very impressed because the share price is only up 44%, less than the market return of 128%. While the long term returns are impressive, we do have some sympathy for those who bought more recently, given the 28% drop, in the last year.
So let's assess the underlying fundamentals over the last 5 years and see if they've moved in lock-step with shareholder returns.
See our latest analysis for Science Applications International
There is no denying that markets are sometimes efficient, but prices do not always reflect underlying business performance. One imperfect but simple way to consider how the market perception of a company has shifted is to compare the change in the earnings per share (EPS) with the share price movement.
During five years of share price growth, Science Applications International achieved compound earnings per share (EPS) growth of 17% per year. This EPS growth is higher than the 8% average annual increase in the share price. Therefore, it seems the market has become relatively pessimistic about the company.
The image below shows how EPS has tracked over time (if you click on the image you can see greater detail).
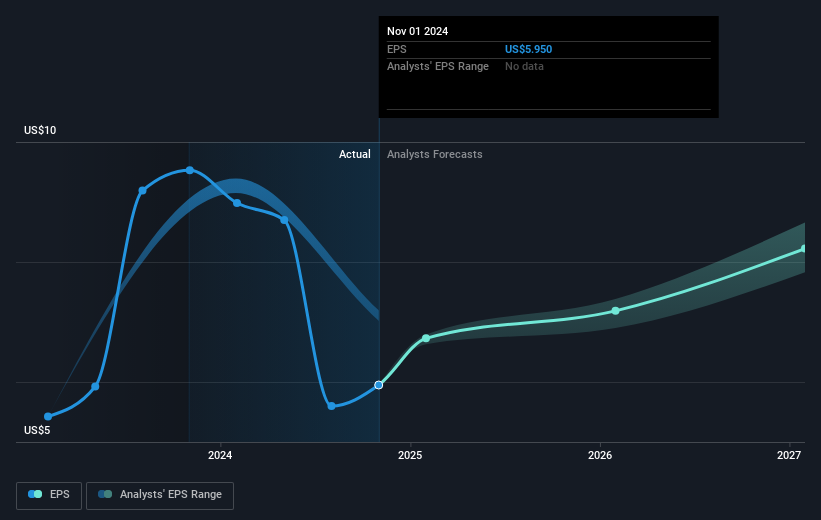
We consider it positive that insiders have made significant purchases in the last year. Having said that, most people consider earnings and revenue growth trends to be a more meaningful guide to the business. It might be well worthwhile taking a look at our free report on Science Applications International's earnings, revenue and cash flow.
What About Dividends?
As well as measuring the share price return, investors should also consider the total shareholder return (TSR). Whereas the share price return only reflects the change in the share price, the TSR includes the value of dividends (assuming they were reinvested) and the benefit of any discounted capital raising or spin-off. It's fair to say that the TSR gives a more complete picture for stocks that pay a dividend. We note that for Science Applications International the TSR over the last 5 years was 55%, which is better than the share price return mentioned above. The dividends paid by the company have thusly boosted the total shareholder return.
A Different Perspective
Science Applications International shareholders are down 28% for the year (even including dividends), but the market itself is up 16%. Even the share prices of good stocks drop sometimes, but we want to see improvements in the fundamental metrics of a business, before getting too interested. On the bright side, long term shareholders have made money, with a gain of 9% per year over half a decade. It could be that the recent sell-off is an opportunity, so it may be worth checking the fundamental data for signs of a long term growth trend. I find it very interesting to look at share price over the long term as a proxy for business performance. But to truly gain insight, we need to consider other information, too. Consider for instance, the ever-present spectre of investment risk. We've identified 3 warning signs with Science Applications International , and understanding them should be part of your investment process.
Science Applications International is not the only stock insiders are buying. So take a peek at this free list of small cap companies at attractive valuations which insiders have been buying.
Please note, the market returns quoted in this article reflect the market weighted average returns of stocks that currently trade on American exchanges.
New: Manage All Your Stock Portfolios in One Place
We've created the ultimate portfolio companion for stock investors, and it's free.
• Connect an unlimited number of Portfolios and see your total in one currency
• Be alerted to new Warning Signs or Risks via email or mobile
• Track the Fair Value of your stocks
Have feedback on this article? Concerned about the content? Get in touch with us directly. Alternatively, email editorial-team (at) simplywallst.com.
This article by Simply Wall St is general in nature. We provide commentary based on historical data and analyst forecasts only using an unbiased methodology and our articles are not intended to be financial advice. It does not constitute a recommendation to buy or sell any stock, and does not take account of your objectives, or your financial situation. We aim to bring you long-term focused analysis driven by fundamental data. Note that our analysis may not factor in the latest price-sensitive company announcements or qualitative material. Simply Wall St has no position in any stocks mentioned.
About NasdaqGS:SAIC
Science Applications International
Provides technical, engineering, and enterprise information technology (IT) services primarily in the United States.
Very undervalued average dividend payer.
