- United States
- /
- Machinery
- /
- NYSE:GTLS
These 4 Measures Indicate That Chart Industries (NYSE:GTLS) Is Using Debt Extensively


Legendary fund manager Li Lu (who Charlie Munger backed) once said, 'The biggest investment risk is not the volatility of prices, but whether you will suffer a permanent loss of capital.' It's only natural to consider a company's balance sheet when you examine how risky it is, since debt is often involved when a business collapses. As with many other companies Chart Industries, Inc. (NYSE:GTLS) makes use of debt. But should shareholders be worried about its use of debt?
When Is Debt Dangerous?
Debt and other liabilities become risky for a business when it cannot easily fulfill those obligations, either with free cash flow or by raising capital at an attractive price. Part and parcel of capitalism is the process of 'creative destruction' where failed businesses are mercilessly liquidated by their bankers. While that is not too common, we often do see indebted companies permanently diluting shareholders because lenders force them to raise capital at a distressed price. By replacing dilution, though, debt can be an extremely good tool for businesses that need capital to invest in growth at high rates of return. When we think about a company's use of debt, we first look at cash and debt together.
View our latest analysis for Chart Industries
What Is Chart Industries's Debt?
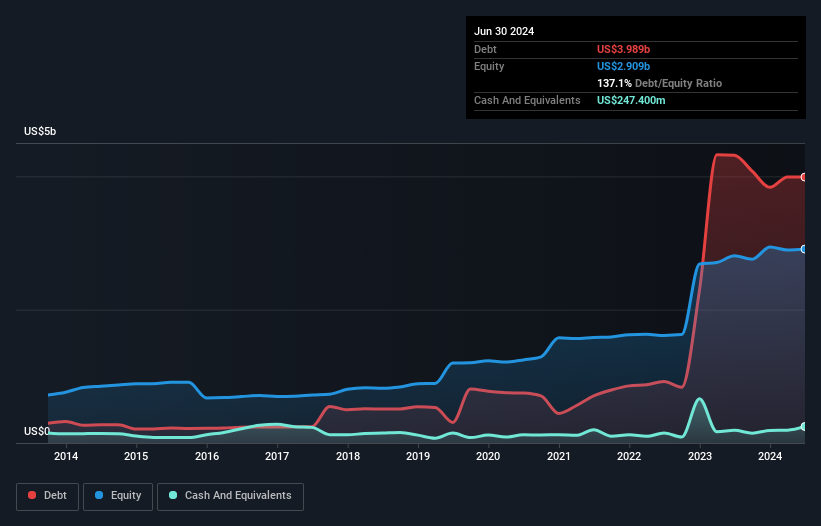
The image below, which you can click on for greater detail, shows that Chart Industries had debt of US$3.99b at the end of June 2024, a reduction from US$4.32b over a year. On the flip side, it has US$247.4m in cash leading to net debt of about US$3.74b.
How Strong Is Chart Industries' Balance Sheet?
The latest balance sheet data shows that Chart Industries had liabilities of US$1.93b due within a year, and liabilities of US$4.44b falling due after that. Offsetting these obligations, it had cash of US$247.4m as well as receivables valued at US$1.44b due within 12 months. So its liabilities outweigh the sum of its cash and (near-term) receivables by US$4.68b.
This deficit is considerable relative to its market capitalization of US$4.85b, so it does suggest shareholders should keep an eye on Chart Industries' use of debt. This suggests shareholders would be heavily diluted if the company needed to shore up its balance sheet in a hurry.
In order to size up a company's debt relative to its earnings, we calculate its net debt divided by its earnings before interest, tax, depreciation, and amortization (EBITDA) and its earnings before interest and tax (EBIT) divided by its interest expense (its interest cover). Thus we consider debt relative to earnings both with and without depreciation and amortization expenses.
While we wouldn't worry about Chart Industries's net debt to EBITDA ratio of 4.4, we think its super-low interest cover of 1.7 times is a sign of high leverage. It seems clear that the cost of borrowing money is negatively impacting returns for shareholders, of late. However, it should be some comfort for shareholders to recall that Chart Industries actually grew its EBIT by a hefty 131%, over the last 12 months. If it can keep walking that path it will be in a position to shed its debt with relative ease. The balance sheet is clearly the area to focus on when you are analysing debt. But it is future earnings, more than anything, that will determine Chart Industries's ability to maintain a healthy balance sheet going forward. So if you're focused on the future you can check out this free report showing analyst profit forecasts.
Finally, a business needs free cash flow to pay off debt; accounting profits just don't cut it. So it's worth checking how much of that EBIT is backed by free cash flow. Over the last three years, Chart Industries recorded negative free cash flow, in total. Debt is far more risky for companies with unreliable free cash flow, so shareholders should be hoping that the past expenditure will produce free cash flow in the future.
Our View
On the face of it, Chart Industries's conversion of EBIT to free cash flow left us tentative about the stock, and its interest cover was no more enticing than the one empty restaurant on the busiest night of the year. But at least it's pretty decent at growing its EBIT; that's encouraging. Overall, we think it's fair to say that Chart Industries has enough debt that there are some real risks around the balance sheet. If everything goes well that may pay off but the downside of this debt is a greater risk of permanent losses. There's no doubt that we learn most about debt from the balance sheet. But ultimately, every company can contain risks that exist outside of the balance sheet. We've identified 2 warning signs with Chart Industries (at least 1 which is a bit concerning) , and understanding them should be part of your investment process.
If you're interested in investing in businesses that can grow profits without the burden of debt, then check out this free list of growing businesses that have net cash on the balance sheet.
If you're looking to trade Chart Industries, open an account with the lowest-cost platform trusted by professionals, Interactive Brokers.
With clients in over 200 countries and territories, and access to 160 markets, IBKR lets you trade stocks, options, futures, forex, bonds and funds from a single integrated account.
Enjoy no hidden fees, no account minimums, and FX conversion rates as low as 0.03%, far better than what most brokers offer.
Sponsored ContentNew: AI Stock Screener & Alerts
Our new AI Stock Screener scans the market every day to uncover opportunities.
• Dividend Powerhouses (3%+ Yield)
• Undervalued Small Caps with Insider Buying
• High growth Tech and AI Companies
Or build your own from over 50 metrics.
Have feedback on this article? Concerned about the content? Get in touch with us directly. Alternatively, email editorial-team (at) simplywallst.com.
This article by Simply Wall St is general in nature. We provide commentary based on historical data and analyst forecasts only using an unbiased methodology and our articles are not intended to be financial advice. It does not constitute a recommendation to buy or sell any stock, and does not take account of your objectives, or your financial situation. We aim to bring you long-term focused analysis driven by fundamental data. Note that our analysis may not factor in the latest price-sensitive company announcements or qualitative material. Simply Wall St has no position in any stocks mentioned.
About NYSE:GTLS
Chart Industries
Engages in the designing, engineering, and manufacturing of process technologies and equipment for the gas and liquid molecules in the United States and internationally.
Solid track record and good value.
Similar Companies
Market Insights

Community Narratives
