- United States
- /
- Machinery
- /
- NYSE:GTLS
Is Chart Industries Still Attractively Priced After Strong Multi Year Share Price Gains?

Reviewed by Bailey Pemberton
- If you have been wondering whether Chart Industries at around $205 a share is still a smart buy or already priced for perfection, you are in the right place.
- The stock has crept up modestly in the short term, with returns of 0.3% over the last week, 1.1% over the last month, and 8.4% year to date, building on a much bigger 76.5% gain over three years and 83.8% over five.
- Recent headlines have focused on Chart Industries as a key player in cryogenic equipment and clean energy infrastructure. This ties its long term story to growth in LNG, hydrogen, and industrial gases. That narrative has helped support the share price, even as investors debate how much future demand is already baked into today’s valuation.
- Right now, Chart Industries scores a 3/6 on our valuation checks, suggesting it looks undervalued on some measures but not across the board. Next we will unpack those different valuation approaches before finishing with an even better way to think about what the stock might really be worth.
Find out why Chart Industries's 4.0% return over the last year is lagging behind its peers.
Approach 1: Chart Industries Discounted Cash Flow (DCF) Analysis
A Discounted Cash Flow model estimates what a company is worth by projecting its future cash flows and then discounting those back to today in dollar terms.
For Chart Industries, the latest twelve month Free Cash Flow is about $350.6 million. Analyst and extrapolated estimates from Simply Wall St indicate projected Free Cash Flow of roughly $928.9 million by 2035. That path includes intermediate projections such as around $606.2 million in 2026 and $749 million in 2029, based on expectations for the business as it scales its cryogenic and clean energy operations.
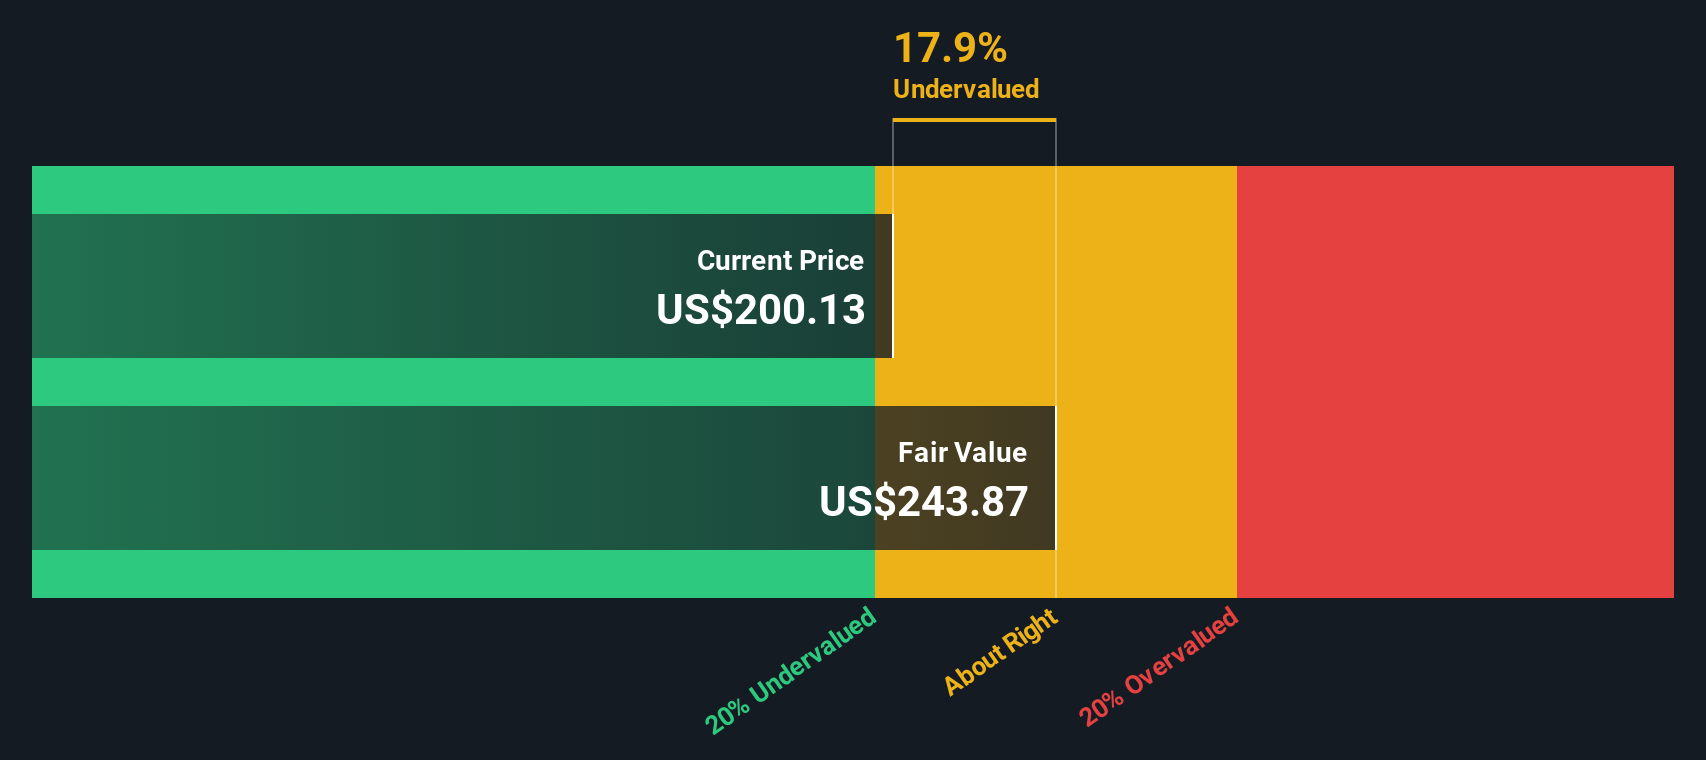
When all those future cash flows are discounted to today using a 2 Stage Free Cash Flow to Equity model, the intrinsic value is estimated at about $248.92 per share. Compared with the current share price near $205, this DCF output indicates the stock is roughly 17.3% below that estimated value, which some long term investors may view as a potential margin of safety if they agree with the cash flow assumptions.
Result: UNDERVALUED
Our Discounted Cash Flow (DCF) analysis suggests Chart Industries is undervalued by 17.3%. Track this in your watchlist or portfolio, or discover 903 more undervalued stocks based on cash flows.
Approach 2: Chart Industries Price vs Sales
For companies that are still scaling profitability but already generating meaningful revenue, the price to sales ratio is often a better yardstick than earnings based metrics. It lets us compare what investors are paying for each dollar of current sales while sidestepping short term noise in margins and interest costs.
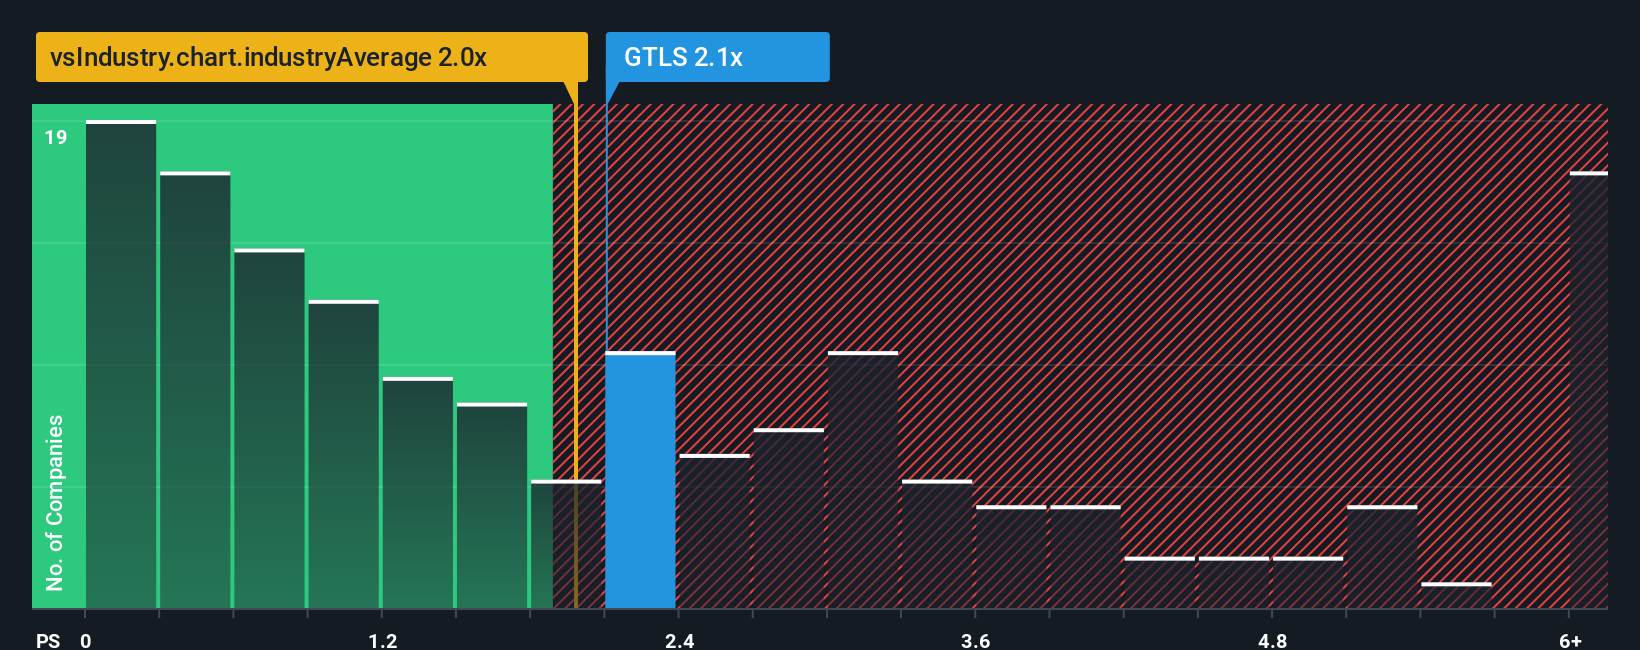
In general, faster revenue growth and lower business risk justify a higher price to sales multiple, while slower growth or higher uncertainty should drag that multiple down. Chart Industries currently trades at about 2.16x sales, compared with the Machinery industry average of roughly 1.98x and a peer group average closer to 3.36x.
Simply Wall St also calculates a Fair Ratio of around 2.45x for Chart Industries, a proprietary estimate of what a normal price to sales multiple could be given its growth outlook, profitability, industry, size, and risk profile. This can be more informative than a simple peer or industry comparison because it adjusts for the company’s specific fundamentals instead of assuming all Machinery stocks deserve the same valuation. With the current 2.16x sitting below the 2.45x Fair Ratio, the shares appear modestly undervalued on this sales based lens.
Result: UNDERVALUED
PS ratios tell one story, but what if the real opportunity lies elsewhere? Discover 1443 companies where insiders are betting big on explosive growth.
Upgrade Your Decision Making: Choose your Chart Industries Narrative
Earlier we mentioned that there is an even better way to understand valuation, so let us introduce you to Narratives, a simple way to connect your view of Chart Industries’ future with a concrete fair value estimate. A Narrative is your story behind the numbers, where you spell out what you think will happen to revenue, earnings, and margins, then see what those assumptions imply for the company’s fair value. Narratives on Simply Wall St, available on the Community page used by millions of investors, link three things: the company’s story, a quantified financial forecast, and a resulting fair value you can compare with today’s share price to decide whether to buy, hold, or sell. Because Narratives update dynamically as new earnings, news, or guidance comes in, your view can evolve alongside the business instead of staying fixed. For example, one Chart Industries Narrative might assume earnings grow to around $740 million and justify a fair value near $227, while a more cautious one bakes in nearer $605 million of earnings and a fair value closer to $169, giving you a clear range of outcomes to benchmark your own view against.
Do you think there's more to the story for Chart Industries? Head over to our Community to see what others are saying!

This article by Simply Wall St is general in nature. We provide commentary based on historical data and analyst forecasts only using an unbiased methodology and our articles are not intended to be financial advice. It does not constitute a recommendation to buy or sell any stock, and does not take account of your objectives, or your financial situation. We aim to bring you long-term focused analysis driven by fundamental data. Note that our analysis may not factor in the latest price-sensitive company announcements or qualitative material. Simply Wall St has no position in any stocks mentioned.
The New Payments ETF Is Live on NASDAQ:
Money is moving to real-time rails, and a newly listed ETF now gives investors direct exposure. Fast settlement. Institutional custody. Simple access.
Explore how this launch could reshape portfolios
Sponsored ContentNew: AI Stock Screener & Alerts
Our new AI Stock Screener scans the market every day to uncover opportunities.
• Dividend Powerhouses (3%+ Yield)
• Undervalued Small Caps with Insider Buying
• High growth Tech and AI Companies
Or build your own from over 50 metrics.
Have feedback on this article? Concerned about the content? Get in touch with us directly. Alternatively, email editorial-team@simplywallst.com
About NYSE:GTLS
Chart Industries
Engages in the designing, engineering, and manufacturing of process technologies and equipment for the gas and liquid molecules in the United States and internationally.
Fair value with moderate growth potential.
Similar Companies
Market Insights

Weekly Picks

THE KINGDOM OF BROWN GOODS: WHY MGPI IS BEING CRUSHED BY INVENTORY & PRIMED FOR RESURRECTION


Why Vertical Aerospace (NYSE: EVTL) is Worth Possibly Over 13x its Current Price


The Quiet Giant That Became AI’s Power Grid
Recently Updated Narratives

Butler National (Buks) outperforms.


A tech powerhouse quietly powering the world’s AI infrastructure.


Keppel DC REIT (SGX: AJBU) is a resilient gem in the data center space.
Popular Narratives

MicroVision will explode future revenue by 380.37% with a vision towards success


Crazy Undervalued 42 Baggers Silver Play (Active & Running Mine)


