- United States
- /
- Machinery
- /
- NYSE:GTLS
Chart Industries (GTLS): Evaluating Valuation After Multi‑Year Shareholder Returns Strengthen Growth Narrative

Reviewed by Simply Wall St
Chart Industries (GTLS) has quietly outpaced the broader market this year, and that kind of steady climb usually makes investors ask the same question: is this just momentum or is the underlying business truly improving?
See our latest analysis for Chart Industries.
With the share price now around $205.94 and a steady year to date share price return of 8.46%, the real story is that multi year total shareholder returns, including an 82.75% three year gain, suggest momentum is still quietly building as investors warm to Chart’s growth and earnings trajectory.
If Chart’s steady climb has you curious about what else might be gaining traction, this could be a smart moment to explore fast growing stocks with high insider ownership.
With earnings growing much faster than revenue and the share price now sitting almost exactly on Wall Street’s target, the big question is whether Chart is still trading below its intrinsic value or if the market has already priced in its future growth?
Most Popular Narrative: 40% Undervalued
With the most followed narrative putting fair value meaningfully above the last close of $205.94, it paints an ambitious picture of Chart’s earnings power.
The integration of Howden has resulted in cost synergies, contributing to an expansion in adjusted operating income margin by 190 basis points, which is expected to bolster future net margins. The company is strategically positioned in high-demand markets such as LNG, data centers, and space exploration, providing a strong pipeline of future projects and potential for significant revenue growth.
Want to see what kind of revenue climb and margin reset could justify this target, even with a lower future earnings multiple than peers? The full narrative reveals the aggressive compounding path behind that valuation call.
Result: Fair Value of $206.67 (UNDERVALUED)
Have a read of the narrative in full and understand what's behind the forecasts.
However, lingering geopolitical tensions and uncertain demand in industrial gas and hydrogen markets could derail backlog conversion and pressure Chart’s projected margin expansion.
Find out about the key risks to this Chart Industries narrative.
Another Angle on Value
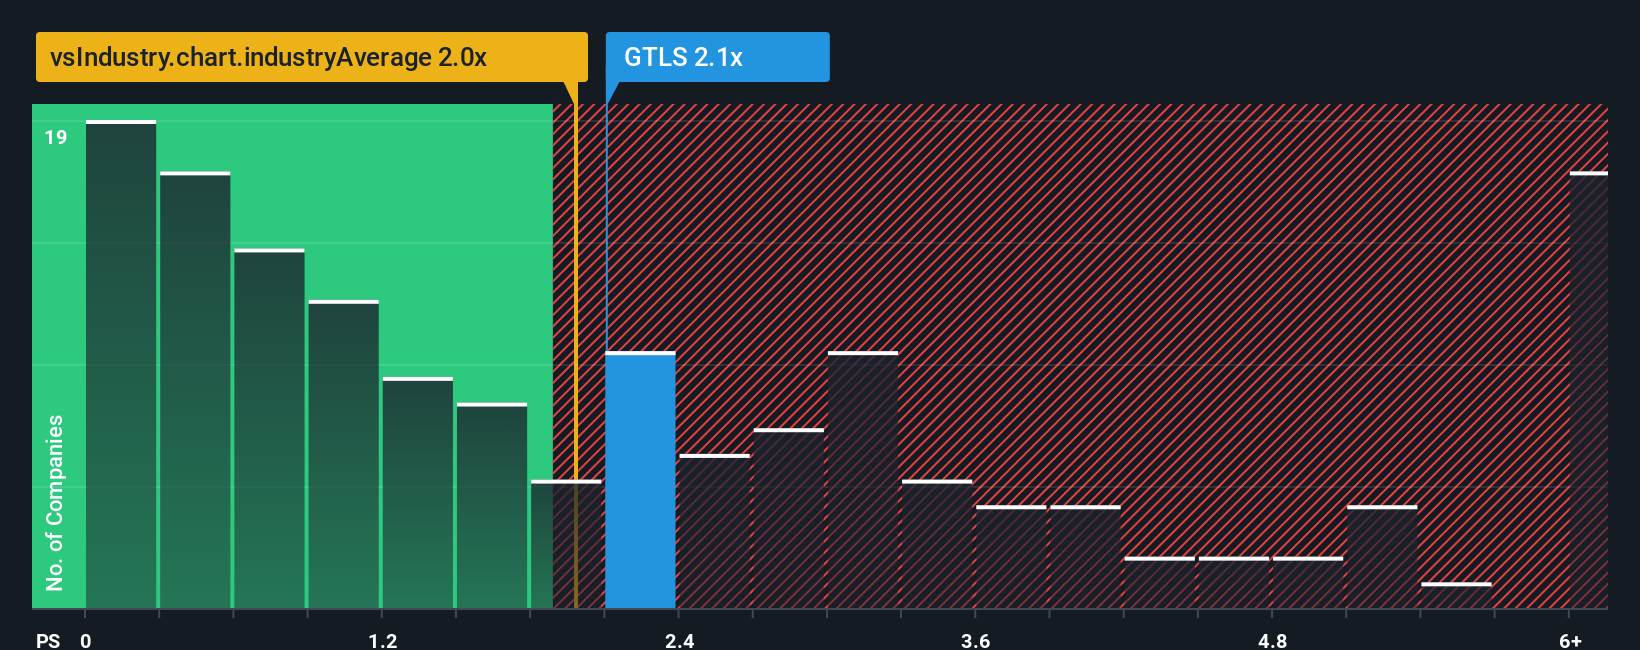
On simple sales metrics, Chart does not look like a giveaway. It trades at 2.2 times sales, slightly richer than the US Machinery average of 2 times, yet still cheaper than close peers at 3.4 times and below its own 2.4 times fair ratio, which suggests a measured opportunity rather than outright mispricing.
See what the numbers say about this price — find out in our valuation breakdown.
Build Your Own Chart Industries Narrative
If this view does not quite fit your own, or you would rather dig into the numbers yourself, you can build a custom take in just a few minutes: Do it your way.
A great starting point for your Chart Industries research is our analysis highlighting 2 key rewards and 3 important warning signs that could impact your investment decision.
Ready for more investing opportunities?
Before you move on, lock in your next potential win by scanning a few focused stock ideas powered by Simply Wall Street’s data driven screeners.
- Capture early stage potential with these 3626 penny stocks with strong financials and zero in on smaller names that already show promising financial strength.
- Ride structural growth by using these 30 healthcare AI stocks to pinpoint companies at the intersection of medicine and cutting edge algorithms.
- Strengthen your income stream through these 13 dividend stocks with yields > 3% and target businesses offering yields above 3% backed by fundamentals.
This article by Simply Wall St is general in nature. We provide commentary based on historical data and analyst forecasts only using an unbiased methodology and our articles are not intended to be financial advice. It does not constitute a recommendation to buy or sell any stock, and does not take account of your objectives, or your financial situation. We aim to bring you long-term focused analysis driven by fundamental data. Note that our analysis may not factor in the latest price-sensitive company announcements or qualitative material. Simply Wall St has no position in any stocks mentioned.
The New Payments ETF Is Live on NASDAQ:
Money is moving to real-time rails, and a newly listed ETF now gives investors direct exposure. Fast settlement. Institutional custody. Simple access.
Explore how this launch could reshape portfolios
Sponsored ContentNew: AI Stock Screener & Alerts
Our new AI Stock Screener scans the market every day to uncover opportunities.
• Dividend Powerhouses (3%+ Yield)
• Undervalued Small Caps with Insider Buying
• High growth Tech and AI Companies
Or build your own from over 50 metrics.
Have feedback on this article? Concerned about the content? Get in touch with us directly. Alternatively, email editorial-team@simplywallst.com
About NYSE:GTLS
Chart Industries
Engages in the designing, engineering, and manufacturing of process technologies and equipment for the gas and liquid molecules in the United States and internationally.
Fair value with moderate growth potential.
Similar Companies
Market Insights

Weekly Picks

THE KINGDOM OF BROWN GOODS: WHY MGPI IS BEING CRUSHED BY INVENTORY & PRIMED FOR RESURRECTION


Why Vertical Aerospace (NYSE: EVTL) is Worth Possibly Over 13x its Current Price


The Quiet Giant That Became AI’s Power Grid
Recently Updated Narratives


A case for USD $14.81 per share based on book value. Be warned, this is a micro-cap dependent on a single mine.

Occidental Petroleum to Become Fairly Priced at $68.29 According to Future Projections

Agfa-Gevaert is a digital and materials turnaround opportunity, with growth potential in ZIRFON, but carrying legacy risks.
Popular Narratives


MicroVision will explode future revenue by 380.37% with a vision towards success


Crazy Undervalued 42 Baggers Silver Play (Active & Running Mine)


