
Advertisement

Some say volatility, rather than debt, is the best way to think about risk as an investor, but Warren Buffett famously said that 'Volatility is far from synonymous with risk.' So it might be obvious that you need to consider debt, when you think about how risky any given stock is, because too much debt can sink a company. We note that Woodward, Inc. (NASDAQ:WWD) does have debt on its balance sheet. But the real question is whether this debt is making the company risky.
When Is Debt A Problem?
Debt and other liabilities become risky for a business when it cannot easily fulfill those obligations, either with free cash flow or by raising capital at an attractive price. If things get really bad, the lenders can take control of the business. However, a more frequent (but still costly) occurrence is where a company must issue shares at bargain-basement prices, permanently diluting shareholders, just to shore up its balance sheet. Of course, debt can be an important tool in businesses, particularly capital heavy businesses. The first step when considering a company's debt levels is to consider its cash and debt together.
Check out our latest analysis for Woodward
What Is Woodward's Debt?
The image below, which you can click on for greater detail, shows that Woodward had debt of US$727.9m at the end of December 2023, a reduction from US$829.2m over a year. On the flip side, it has US$144.3m in cash leading to net debt of about US$583.6m.
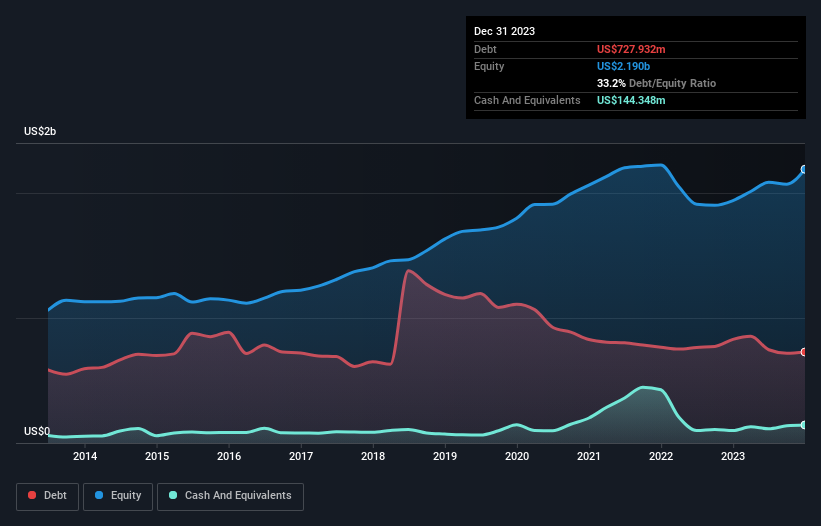
A Look At Woodward's Liabilities
Zooming in on the latest balance sheet data, we can see that Woodward had liabilities of US$582.8m due within 12 months and liabilities of US$1.36b due beyond that. Offsetting this, it had US$144.3m in cash and US$789.4m in receivables that were due within 12 months. So it has liabilities totalling US$1.01b more than its cash and near-term receivables, combined.
Given Woodward has a market capitalization of US$8.89b, it's hard to believe these liabilities pose much threat. Having said that, it's clear that we should continue to monitor its balance sheet, lest it change for the worse.
We measure a company's debt load relative to its earnings power by looking at its net debt divided by its earnings before interest, tax, depreciation, and amortization (EBITDA) and by calculating how easily its earnings before interest and tax (EBIT) cover its interest expense (interest cover). Thus we consider debt relative to earnings both with and without depreciation and amortization expenses.
Woodward has a low net debt to EBITDA ratio of only 1.2. And its EBIT easily covers its interest expense, being 11.3 times the size. So you could argue it is no more threatened by its debt than an elephant is by a mouse. In addition to that, we're happy to report that Woodward has boosted its EBIT by 75%, thus reducing the spectre of future debt repayments. When analysing debt levels, the balance sheet is the obvious place to start. But ultimately the future profitability of the business will decide if Woodward can strengthen its balance sheet over time. So if you're focused on the future you can check out this free report showing analyst profit forecasts.
Finally, a company can only pay off debt with cold hard cash, not accounting profits. So we clearly need to look at whether that EBIT is leading to corresponding free cash flow. During the last three years, Woodward generated free cash flow amounting to a very robust 81% of its EBIT, more than we'd expect. That puts it in a very strong position to pay down debt.
Our View
Happily, Woodward's impressive conversion of EBIT to free cash flow implies it has the upper hand on its debt. And the good news does not stop there, as its EBIT growth rate also supports that impression! Considering this range of factors, it seems to us that Woodward is quite prudent with its debt, and the risks seem well managed. So the balance sheet looks pretty healthy, to us. Over time, share prices tend to follow earnings per share, so if you're interested in Woodward, you may well want to click here to check an interactive graph of its earnings per share history.
If you're interested in investing in businesses that can grow profits without the burden of debt, then check out this free list of growing businesses that have net cash on the balance sheet.
Valuation is complex, but we're here to simplify it.
Discover if Woodward might be undervalued or overvalued with our detailed analysis, featuring fair value estimates, potential risks, dividends, insider trades, and its financial condition.
Access Free AnalysisHave feedback on this article? Concerned about the content? Get in touch with us directly. Alternatively, email editorial-team (at) simplywallst.com.
This article by Simply Wall St is general in nature. We provide commentary based on historical data and analyst forecasts only using an unbiased methodology and our articles are not intended to be financial advice. It does not constitute a recommendation to buy or sell any stock, and does not take account of your objectives, or your financial situation. We aim to bring you long-term focused analysis driven by fundamental data. Note that our analysis may not factor in the latest price-sensitive company announcements or qualitative material. Simply Wall St has no position in any stocks mentioned.
About NasdaqGS:WWD
Woodward
Designs, manufactures, and services control solutions for the aerospace and industrial markets worldwide.
Flawless balance sheet with solid track record.
Similar Companies
Market Insights

Advertisement
Community Narratives
Enterprise, AI & Cloud Growth Ahead, Waiting For the Right Price 💸
Fair Value US$204.74|6.7% overvalued
FR
Community Contributor
Good foundation, but now it's all about the next steps
Fair Value US$147.87|23.9% undervalued
TO
Community Contributor
XTB's Path to 100–120 PLN by 2028 Amid Market Volatility
Fair Value zł100.96|33.3% undervalued
DZ
Community Contributor