
Advertisement
- United States
- /
- Banks
- /
- NYSE:STEL
Earnings are growing at Stellar Bancorp (NYSE:STEL) but shareholders still don't like its prospects

The main aim of stock picking is to find the market-beating stocks. But even the best stock picker will only win with some selections. So we wouldn't blame long term Stellar Bancorp, Inc. (NYSE:STEL) shareholders for doubting their decision to hold, with the stock down 41% over a half decade. And some of the more recent buyers are probably worried, too, with the stock falling 30% in the last year. Even worse, it's down 18% in about a month, which isn't fun at all.
Given the past week has been tough on shareholders, let's investigate the fundamentals and see what we can learn.
See our latest analysis for Stellar Bancorp
While the efficient markets hypothesis continues to be taught by some, it has been proven that markets are over-reactive dynamic systems, and investors are not always rational. One way to examine how market sentiment has changed over time is to look at the interaction between a company's share price and its earnings per share (EPS).
While the share price declined over five years, Stellar Bancorp actually managed to increase EPS by an average of 0.5% per year. So it doesn't seem like EPS is a great guide to understanding how the market is valuing the stock. Or possibly, the market was previously very optimistic, so the stock has disappointed, despite improving EPS.
Based on these numbers, we'd venture that the market may have been over-optimistic about forecast growth, half a decade ago. Looking to other metrics might better explain the share price change.
Revenue is actually up 19% over the time period. So it seems one might have to take closer look at the fundamentals to understand why the share price languishes. After all, there may be an opportunity.
The image below shows how earnings and revenue have tracked over time (if you click on the image you can see greater detail).
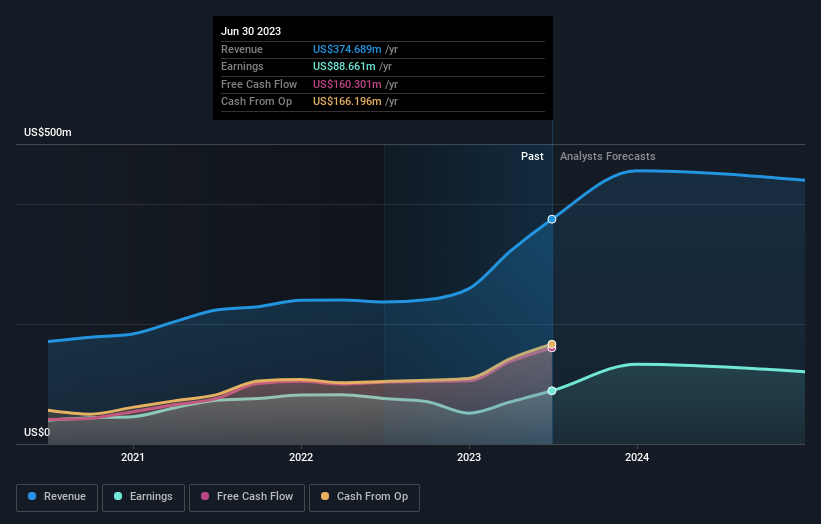
We consider it positive that insiders have made significant purchases in the last year. Having said that, most people consider earnings and revenue growth trends to be a more meaningful guide to the business. This free report showing analyst forecasts should help you form a view on Stellar Bancorp
What About Dividends?
It is important to consider the total shareholder return, as well as the share price return, for any given stock. The TSR incorporates the value of any spin-offs or discounted capital raisings, along with any dividends, based on the assumption that the dividends are reinvested. It's fair to say that the TSR gives a more complete picture for stocks that pay a dividend. As it happens, Stellar Bancorp's TSR for the last 5 years was -36%, which exceeds the share price return mentioned earlier. And there's no prize for guessing that the dividend payments largely explain the divergence!
A Different Perspective
Stellar Bancorp shareholders are down 29% for the year (even including dividends), but the market itself is up 7.9%. However, keep in mind that even the best stocks will sometimes underperform the market over a twelve month period. Regrettably, last year's performance caps off a bad run, with the shareholders facing a total loss of 6% per year over five years. Generally speaking long term share price weakness can be a bad sign, though contrarian investors might want to research the stock in hope of a turnaround. It's always interesting to track share price performance over the longer term. But to understand Stellar Bancorp better, we need to consider many other factors. Consider for instance, the ever-present spectre of investment risk. We've identified 3 warning signs with Stellar Bancorp (at least 1 which is a bit concerning) , and understanding them should be part of your investment process.
Stellar Bancorp is not the only stock insiders are buying. So take a peek at this free list of growing companies with insider buying.
Please note, the market returns quoted in this article reflect the market weighted average returns of stocks that currently trade on American exchanges.
New: Manage All Your Stock Portfolios in One Place
We've created the ultimate portfolio companion for stock investors, and it's free.
• Connect an unlimited number of Portfolios and see your total in one currency
• Be alerted to new Warning Signs or Risks via email or mobile
• Track the Fair Value of your stocks
Have feedback on this article? Concerned about the content? Get in touch with us directly. Alternatively, email editorial-team (at) simplywallst.com.
This article by Simply Wall St is general in nature. We provide commentary based on historical data and analyst forecasts only using an unbiased methodology and our articles are not intended to be financial advice. It does not constitute a recommendation to buy or sell any stock, and does not take account of your objectives, or your financial situation. We aim to bring you long-term focused analysis driven by fundamental data. Note that our analysis may not factor in the latest price-sensitive company announcements or qualitative material. Simply Wall St has no position in any stocks mentioned.
About NYSE:STEL
Stellar Bancorp
Operates as the bank holding company that provides a range of commercial banking products and services primarily to small and medium-sized businesses, professionals, and individual customers.
Flawless balance sheet and slightly overvalued.
Similar Companies
Market Insights

Advertisement
Community Narratives
Groundbreaking therapies that could change the treatment landscape for PTSD, fibromyalgia, MS & Alzheimer’s
Fair Value US$6.20|86.9% undervalued
CM
Community Contributor
DigitalOcean Will Grow 14% by Embracing AI with Paperspace Acquisition
Fair Value US$50.00|40.2% undervalued
NE
Community Contributor
Viant Technology: A Rising AdTech Challenger in the AI-Powered CTV Market
Fair Value US$38.61|62.7% undervalued
BL
Community Contributor
Volvo will Accelerate Forward into Electric and Autonomous Leadership in Five Years
Fair Value SEK 438.80|39.7% undervalued
UN
Community Contributor