- United States
- /
- Banks
- /
- NYSE:NBHC
The total return for National Bank Holdings (NYSE:NBHC) investors has risen faster than earnings growth over the last year


These days it's easy to simply buy an index fund, and your returns should (roughly) match the market. But one can do better than that by picking better than average stocks (as part of a diversified portfolio). To wit, the National Bank Holdings Corporation (NYSE:NBHC) share price is 40% higher than it was a year ago, much better than the market return of around 32% (not including dividends) in the same period. If it can keep that out-performance up over the long term, investors will do very well! However, the longer term returns haven't been so impressive, with the stock up just 1.5% in the last three years.
In light of the stock dropping 4.8% in the past week, we want to investigate the longer term story, and see if fundamentals have been the driver of the company's positive one-year return.
Check out our latest analysis for National Bank Holdings
While the efficient markets hypothesis continues to be taught by some, it has been proven that markets are over-reactive dynamic systems, and investors are not always rational. One flawed but reasonable way to assess how sentiment around a company has changed is to compare the earnings per share (EPS) with the share price.
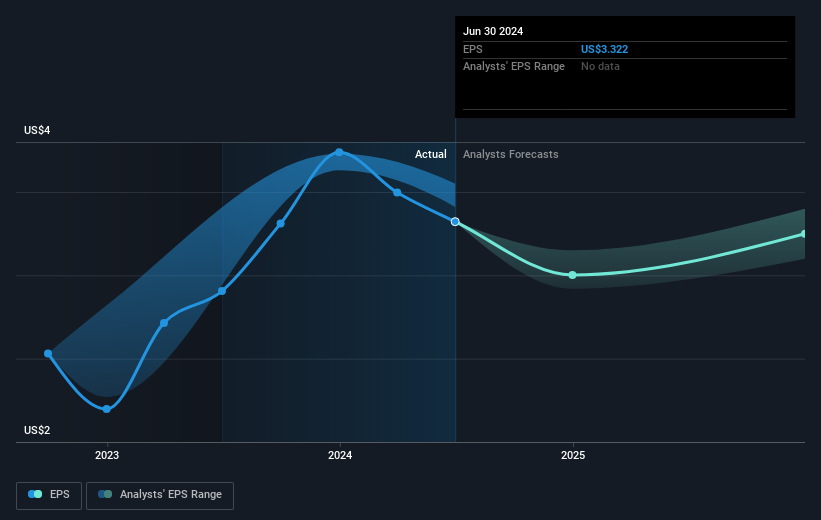
During the last year National Bank Holdings grew its earnings per share (EPS) by 14%. This EPS growth is significantly lower than the 40% increase in the share price. So it's fair to assume the market has a higher opinion of the business than it a year ago.
The image below shows how EPS has tracked over time (if you click on the image you can see greater detail).
We know that National Bank Holdings has improved its bottom line lately, but is it going to grow revenue? Check if analysts think National Bank Holdings will grow revenue in the future.
What About Dividends?
When looking at investment returns, it is important to consider the difference between total shareholder return (TSR) and share price return. The TSR incorporates the value of any spin-offs or discounted capital raisings, along with any dividends, based on the assumption that the dividends are reinvested. Arguably, the TSR gives a more comprehensive picture of the return generated by a stock. As it happens, National Bank Holdings' TSR for the last 1 year was 44%, which exceeds the share price return mentioned earlier. And there's no prize for guessing that the dividend payments largely explain the divergence!
A Different Perspective
We're pleased to report that National Bank Holdings shareholders have received a total shareholder return of 44% over one year. That's including the dividend. That's better than the annualised return of 6% over half a decade, implying that the company is doing better recently. In the best case scenario, this may hint at some real business momentum, implying that now could be a great time to delve deeper. It's always interesting to track share price performance over the longer term. But to understand National Bank Holdings better, we need to consider many other factors. Even so, be aware that National Bank Holdings is showing 1 warning sign in our investment analysis , you should know about...
For those who like to find winning investments this free list of undervalued companies with recent insider purchasing, could be just the ticket.
Please note, the market returns quoted in this article reflect the market weighted average returns of stocks that currently trade on American exchanges.
Valuation is complex, but we're here to simplify it.
Discover if National Bank Holdings might be undervalued or overvalued with our detailed analysis, featuring fair value estimates, potential risks, dividends, insider trades, and its financial condition.
Access Free AnalysisHave feedback on this article? Concerned about the content? Get in touch with us directly. Alternatively, email editorial-team (at) simplywallst.com.
This article by Simply Wall St is general in nature. We provide commentary based on historical data and analyst forecasts only using an unbiased methodology and our articles are not intended to be financial advice. It does not constitute a recommendation to buy or sell any stock, and does not take account of your objectives, or your financial situation. We aim to bring you long-term focused analysis driven by fundamental data. Note that our analysis may not factor in the latest price-sensitive company announcements or qualitative material. Simply Wall St has no position in any stocks mentioned.
About NYSE:NBHC
National Bank Holdings
Operates as the bank holding company for NBH Bank that provides various banking products and financial services to commercial, business, and consumer clients in the United States.
Flawless balance sheet established dividend payer.

