
Advertisement
- United States
- /
- Banks
- /
- NasdaqGM:MPB
Mid Penn Bancorp (NASDAQ:MPB) sheds 13% this week, as yearly returns fall more in line with earnings growth
Mid Penn Bancorp, Inc. (NASDAQ:MPB) shareholders might be concerned after seeing the share price drop 19% in the last quarter. But at least the stock is up over the last three years. However, it's unlikely many shareholders are elated with the share price gain of 58% over that time, given the rising market.
While this past week has detracted from the company's three-year return, let's look at the recent trends of the underlying business and see if the gains have been in alignment.
See our latest analysis for Mid Penn Bancorp
While the efficient markets hypothesis continues to be taught by some, it has been proven that markets are over-reactive dynamic systems, and investors are not always rational. One flawed but reasonable way to assess how sentiment around a company has changed is to compare the earnings per share (EPS) with the share price.
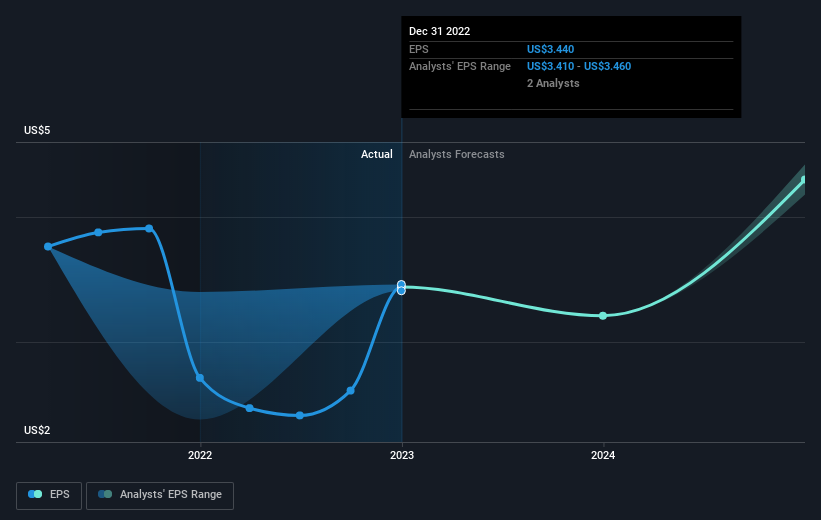
During three years of share price growth, Mid Penn Bancorp achieved compound earnings per share growth of 18% per year. We note that the 17% yearly (average) share price gain isn't too far from the EPS growth rate. Coincidence? Probably not. This suggests that sentiment and expectations have not changed drastically. Au contraire, the share price change has arguably mimicked the EPS growth.
The image below shows how EPS has tracked over time (if you click on the image you can see greater detail).
It's good to see that there was some significant insider buying in the last three months. That's a positive. That said, we think earnings and revenue growth trends are even more important factors to consider. Before buying or selling a stock, we always recommend a close examination of historic growth trends, available here..
What About Dividends?
It is important to consider the total shareholder return, as well as the share price return, for any given stock. Whereas the share price return only reflects the change in the share price, the TSR includes the value of dividends (assuming they were reinvested) and the benefit of any discounted capital raising or spin-off. Arguably, the TSR gives a more comprehensive picture of the return generated by a stock. As it happens, Mid Penn Bancorp's TSR for the last 3 years was 74%, which exceeds the share price return mentioned earlier. The dividends paid by the company have thusly boosted the total shareholder return.
A Different Perspective
While it's certainly disappointing to see that Mid Penn Bancorp shares lost 0.6% throughout the year, that wasn't as bad as the market loss of 7.3%. What is more upsetting is the 0.7% per annum loss investors have suffered over the last half decade. This sort of share price action isn't particularly encouraging, but at least the losses are slowing. While it is well worth considering the different impacts that market conditions can have on the share price, there are other factors that are even more important. Even so, be aware that Mid Penn Bancorp is showing 1 warning sign in our investment analysis , you should know about...
Mid Penn Bancorp is not the only stock that insiders are buying. For those who like to find winning investments this free list of growing companies with recent insider purchasing, could be just the ticket.
Please note, the market returns quoted in this article reflect the market weighted average returns of stocks that currently trade on US exchanges.
New: Manage All Your Stock Portfolios in One Place
We've created the ultimate portfolio companion for stock investors, and it's free.
• Connect an unlimited number of Portfolios and see your total in one currency
• Be alerted to new Warning Signs or Risks via email or mobile
• Track the Fair Value of your stocks
Have feedback on this article? Concerned about the content? Get in touch with us directly. Alternatively, email editorial-team (at) simplywallst.com.
This article by Simply Wall St is general in nature. We provide commentary based on historical data and analyst forecasts only using an unbiased methodology and our articles are not intended to be financial advice. It does not constitute a recommendation to buy or sell any stock, and does not take account of your objectives, or your financial situation. We aim to bring you long-term focused analysis driven by fundamental data. Note that our analysis may not factor in the latest price-sensitive company announcements or qualitative material. Simply Wall St has no position in any stocks mentioned.
About NasdaqGM:MPB
Mid Penn Bancorp
Operates as the bank holding company for Mid Penn Bank that provides commercial banking services to individuals, partnerships, non-profit organizations, and corporations.
Flawless balance sheet with reasonable growth potential.
Similar Companies
Market Insights

Advertisement
Community Narratives
Quality at a Premium. A time to watch, not to buy?
Fair Value US$154.56|29.9% undervalued
DA
Community Contributor
GRAB: The Super-App at the Heart of Southeast Asia’s Digital Boom
Fair Value US$6.60|4.2% undervalued
BL
Community Contributor
Verve Group to Surge with 51.61% Revenue Growth
Fair Value €6.00|65.0% undervalued
ME
Community Contributor