
Advertisement

Over the last 7 days, the United States market has risen by 1.5%, contributing to a significant 18% climb over the past year, with earnings forecasted to grow by 15% annually. In this thriving environment, selecting dividend stocks that offer attractive yields and stability can be a strategic way to enhance your portfolio's performance.
Top 10 Dividend Stocks In The United States
| Name | Dividend Yield | Dividend Rating |
| Valley National Bancorp (VLY) | 4.62% | ★★★★★☆ |
| Universal (UVV) | 6.07% | ★★★★★★ |
| Peoples Bancorp (PEBO) | 5.51% | ★★★★★☆ |
| First Interstate BancSystem (FIBK) | 6.34% | ★★★★★★ |
| Ennis (EBF) | 5.52% | ★★★★★★ |
| Dillard's (DDS) | 5.07% | ★★★★★★ |
| Credicorp (BAP) | 4.62% | ★★★★★☆ |
| CompX International (CIX) | 4.87% | ★★★★★★ |
| Columbia Banking System (COLB) | 5.86% | ★★★★★★ |
| Citizens & Northern (CZNC) | 5.76% | ★★★★★☆ |
Click here to see the full list of 138 stocks from our Top US Dividend Stocks screener.
Let's dive into some prime choices out of the screener.
Farmers National Banc (FMNB)
Simply Wall St Dividend Rating: ★★★★★☆
Overview: Farmers National Banc Corp. is a bank holding company for The Farmers National Bank of Canfield, providing banking, trust, retirement consulting, insurance, and financial management services with a market cap of $503.66 million.
Operations: Farmers National Banc Corp. generates revenue through its operations in banking, trust services, retirement consulting, insurance, and financial management businesses.
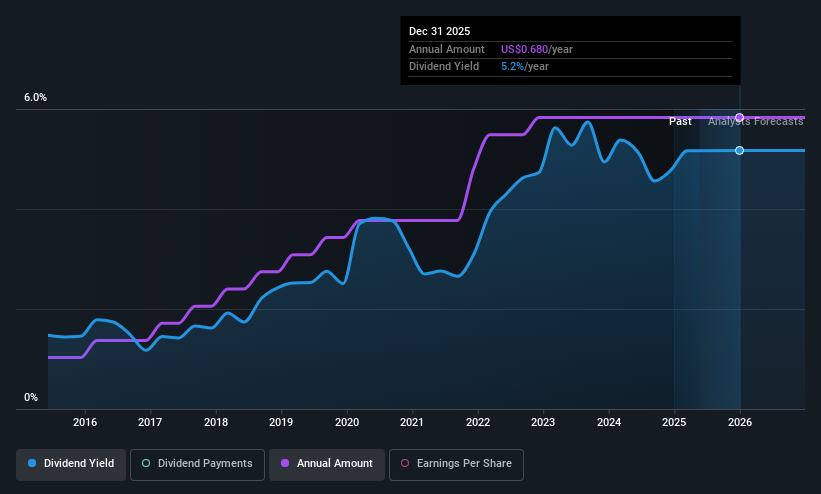
Dividend Yield: 4.8%
Farmers National Banc's dividends have been stable and reliable over the past decade, with recent affirmations of a quarterly cash dividend of US$0.17 per share. The company's payout ratio stands at 50.7%, indicating dividends are covered by earnings, though future coverage remains uncertain. Trading below estimated fair value, it offers a dividend yield of 4.77%, placing it in the top quartile among U.S. dividend payers despite modest net charge-offs and no recent share buybacks reported this year.
- Unlock comprehensive insights into our analysis of Farmers National Banc stock in this dividend report.
- Our expertly prepared valuation report Farmers National Banc implies its share price may be lower than expected.
Dillard's (DDS)
Simply Wall St Dividend Rating: ★★★★★★
Overview: Dillard's, Inc. operates retail department stores across the southeastern, southwestern, and midwestern United States and has a market cap of approximately $7.81 billion.
Operations: Dillard's generates revenue primarily from its retail operations, which account for $6.30 billion, with an additional contribution of $296.79 million from construction activities.
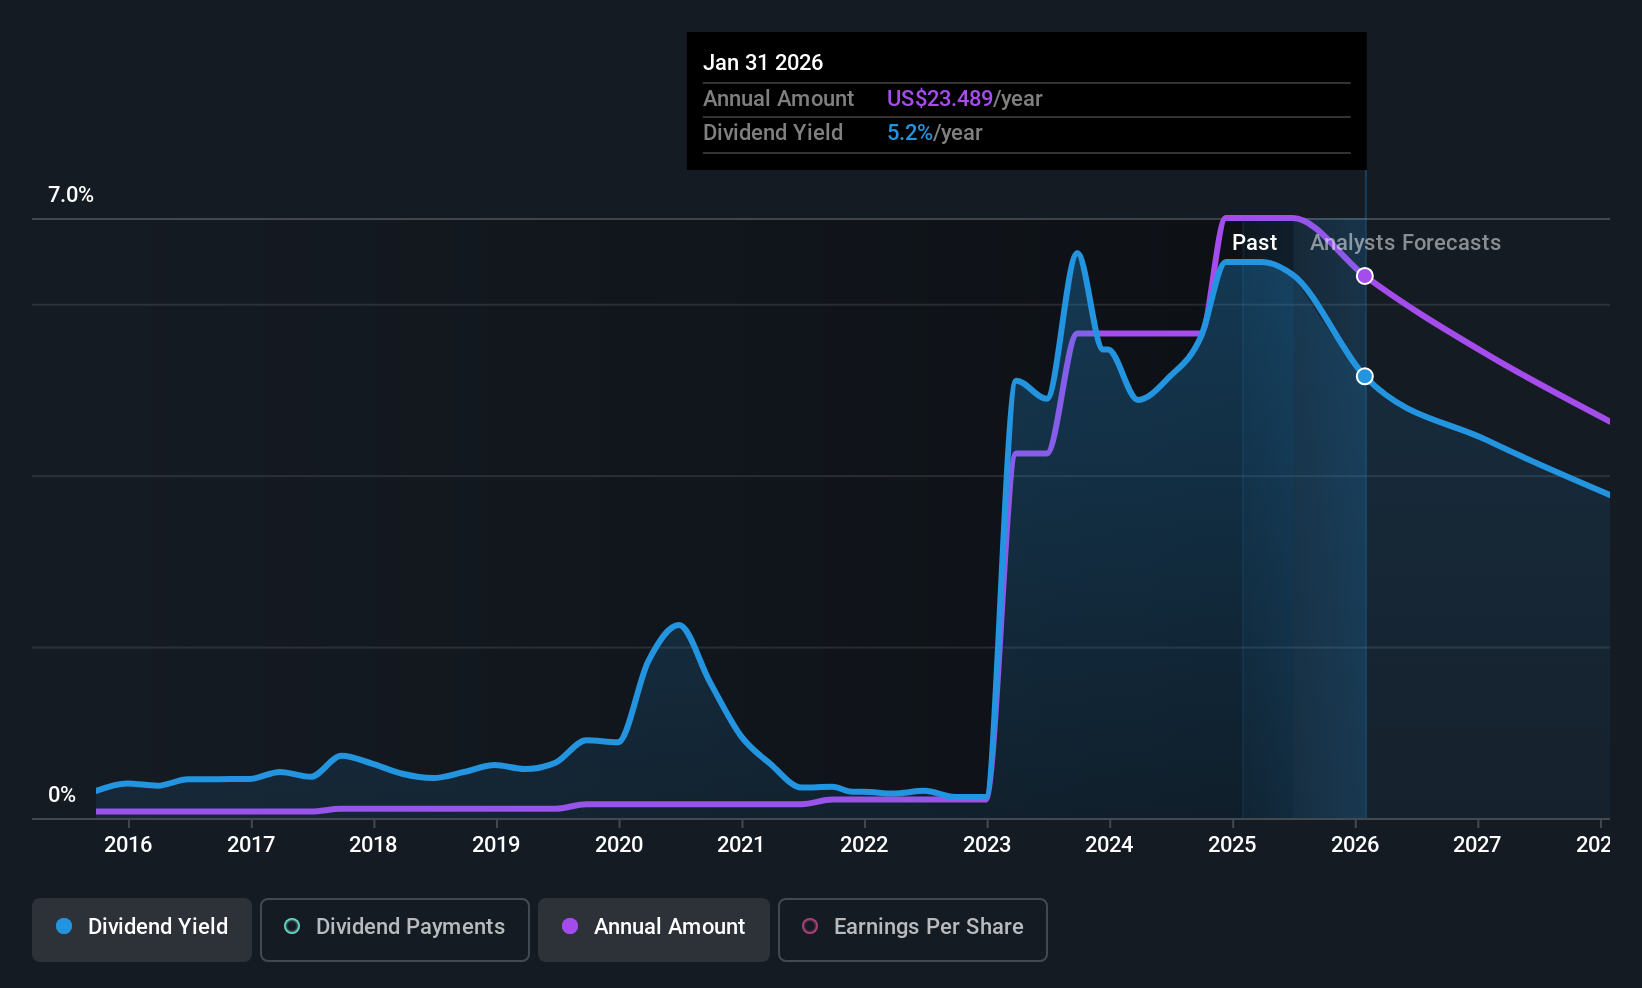
Dividend Yield: 5.1%
Dillard's maintains a robust dividend profile with a low payout ratio of 2.8%, ensuring dividends are well-covered by earnings and cash flows. Offering a high yield of 5.07%, it ranks in the top 25% of U.S. dividend payers, supported by stable and growing dividends over the past decade. Recent announcements include a US$0.25 per share dividend, payable on August 4, 2025, alongside strategic buybacks totaling US$325 million to enhance shareholder value.
- Click to explore a detailed breakdown of our findings in Dillard's dividend report.
- Insights from our recent valuation report point to the potential overvaluation of Dillard's shares in the market.
Hyster-Yale (HY)
Simply Wall St Dividend Rating: ★★★★★☆
Overview: Hyster-Yale, Inc. operates globally through its subsidiaries by designing, engineering, manufacturing, selling, and servicing a range of lift trucks, attachments, and aftermarket parts with a market cap of approximately $775.60 million.
Operations: Hyster-Yale's revenue segments include $3.15 billion from the Lift Truck Business in the Americas, $626.40 million from EMEA, $193.30 million from JAPIC, and $363.20 million from Bolzoni.
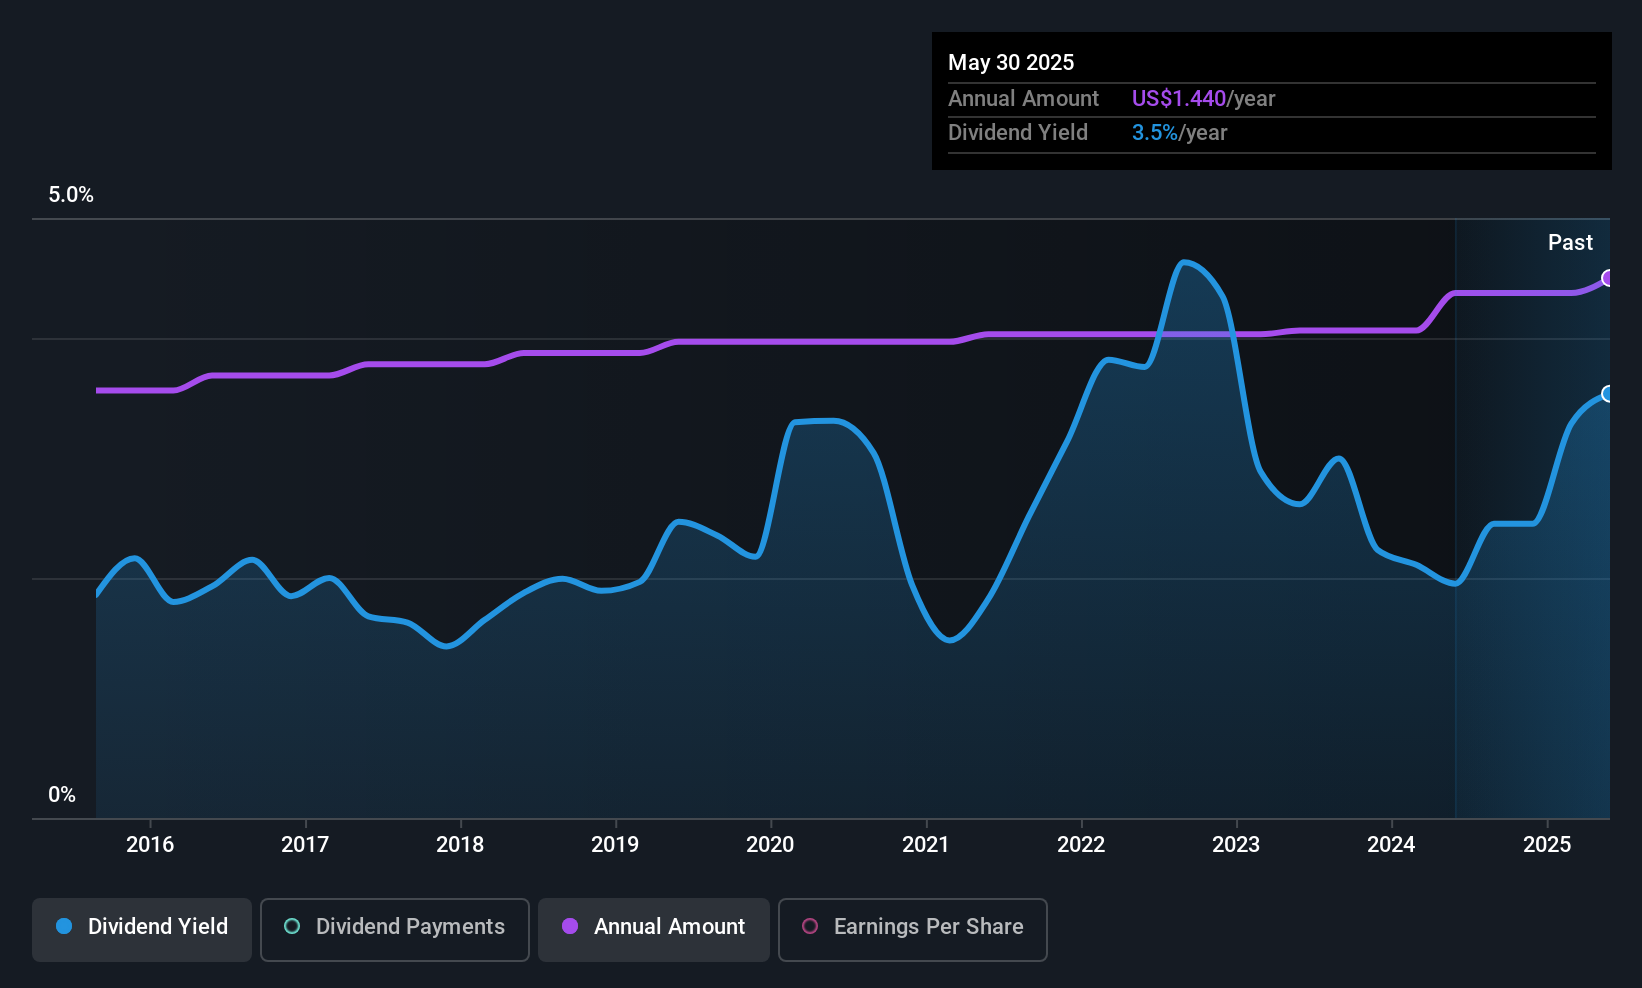
Dividend Yield: 3.3%
Hyster-Yale's dividend yield of 3.31% is stable and has grown over the past decade, though it lags behind top U.S. dividend payers. The payout ratios of 24.6% for earnings and 41.8% for cash flows indicate sustainability, despite declining profit margins from last year and high debt levels. Recent strategic realignments aim to boost profitability through cost reductions and energy solutions, while index removals could impact market perception amidst a new US$300 million revolving credit facility arrangement.
- Delve into the full analysis dividend report here for a deeper understanding of Hyster-Yale.
- Our valuation report unveils the possibility Hyster-Yale's shares may be trading at a discount.
Key Takeaways
- Discover the full array of 138 Top US Dividend Stocks right here.
- Have you diversified into these companies? Leverage the power of Simply Wall St's portfolio to keep a close eye on market movements affecting your investments.
- Simply Wall St is a revolutionary app designed for long-term stock investors, it's free and covers every market in the world.
Ready For A Different Approach?
- Explore high-performing small cap companies that haven't yet garnered significant analyst attention.
- Fuel your portfolio with companies showing strong growth potential, backed by optimistic outlooks both from analysts and management.
- Find companies with promising cash flow potential yet trading below their fair value.
This article by Simply Wall St is general in nature. We provide commentary based on historical data and analyst forecasts only using an unbiased methodology and our articles are not intended to be financial advice. It does not constitute a recommendation to buy or sell any stock, and does not take account of your objectives, or your financial situation. We aim to bring you long-term focused analysis driven by fundamental data. Note that our analysis may not factor in the latest price-sensitive company announcements or qualitative material. Simply Wall St has no position in any stocks mentioned.
New: Manage All Your Stock Portfolios in One Place
We've created the ultimate portfolio companion for stock investors, and it's free.
• Connect an unlimited number of Portfolios and see your total in one currency
• Be alerted to new Warning Signs or Risks via email or mobile
• Track the Fair Value of your stocks
Have feedback on this article? Concerned about the content? Get in touch with us directly. Alternatively, email editorial-team@simplywallst.com
About NYSE:DDS
Dillard's
Operates retail department stores in the southeastern, southwestern, and midwestern areas of the United States.
Flawless balance sheet 6 star dividend payer.
Similar Companies
Market Insights


Advertisement
Community Narratives
Alphabet: The Under-appreciated Compounder Hiding in Plain Sight
Fair Value US$268.43|27.9% undervalued
BL
Community Contributor
Planet Labs: At The Heart Of The Emerging New Space Boom
Fair Value US$11.31|43.8% undervalued
AN
Community Contributor
Exxon in Guyana 5 year forecast Low $135 to High $189
Fair Value US$189.00|41.0% undervalued
AG
Community Contributor