- United States
- /
- Banks
- /
- NasdaqGM:BCBP
Despite the downward trend in earnings at BCB Bancorp (NASDAQ:BCBP) the stock spikes 10%, bringing one-year gains to 30%


On average, over time, stock markets tend to rise higher. This makes investing attractive. But not every stock you buy will perform as well as the overall market. Unfortunately for shareholders, while the BCB Bancorp, Inc. (NASDAQ:BCBP) share price is up 22% in the last year, that falls short of the market return. On the other hand, longer term shareholders have had a tougher run, with the stock falling 11% in three years.
The past week has proven to be lucrative for BCB Bancorp investors, so let's see if fundamentals drove the company's one-year performance.
Check out our latest analysis for BCB Bancorp
While markets are a powerful pricing mechanism, share prices reflect investor sentiment, not just underlying business performance. One way to examine how market sentiment has changed over time is to look at the interaction between a company's share price and its earnings per share (EPS).
Over the last twelve months, BCB Bancorp actually shrank its EPS by 51%.
So we don't think that investors are paying too much attention to EPS. Indeed, when EPS is declining but the share price is up, it often means the market is considering other factors.
We haven't seen BCB Bancorp increase dividend payments yet, so the yield probably hasn't helped drive the share higher. It saw it's revenue decline by 21% over twelve months. Usually that correlates with a lower share price, but let's face it, the gyrations of the market are sometimes only as clear as mud.
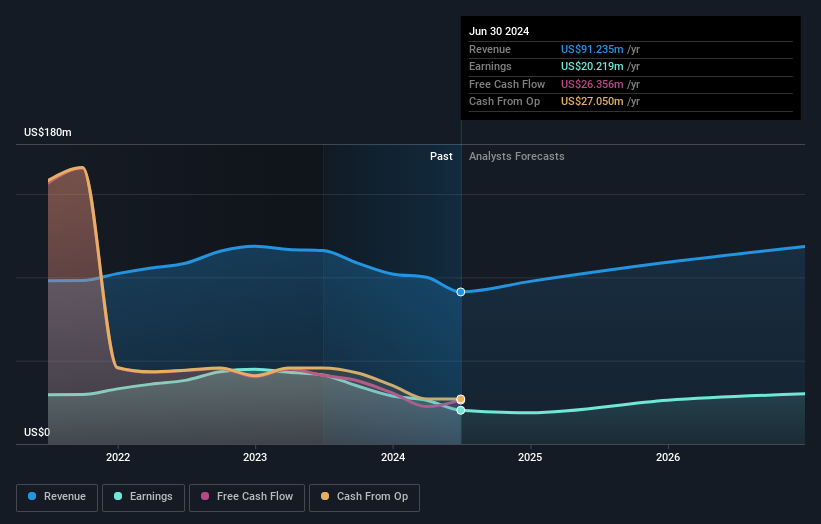
You can see below how earnings and revenue have changed over time (discover the exact values by clicking on the image).
We like that insiders have been buying shares in the last twelve months. Even so, future earnings will be far more important to whether current shareholders make money. So it makes a lot of sense to check out what analysts think BCB Bancorp will earn in the future (free profit forecasts).
What About Dividends?
As well as measuring the share price return, investors should also consider the total shareholder return (TSR). The TSR is a return calculation that accounts for the value of cash dividends (assuming that any dividend received was reinvested) and the calculated value of any discounted capital raisings and spin-offs. So for companies that pay a generous dividend, the TSR is often a lot higher than the share price return. In the case of BCB Bancorp, it has a TSR of 30% for the last 1 year. That exceeds its share price return that we previously mentioned. This is largely a result of its dividend payments!
A Different Perspective
BCB Bancorp provided a TSR of 30% over the last twelve months. Unfortunately this falls short of the market return. On the bright side, that's still a gain, and it's actually better than the average return of 5% over half a decade This suggests the company might be improving over time. I find it very interesting to look at share price over the long term as a proxy for business performance. But to truly gain insight, we need to consider other information, too. Take risks, for example - BCB Bancorp has 1 warning sign we think you should be aware of.
If you like to buy stocks alongside management, then you might just love this free list of companies. (Hint: most of them are flying under the radar).
Please note, the market returns quoted in this article reflect the market weighted average returns of stocks that currently trade on American exchanges.
Valuation is complex, but we're here to simplify it.
Discover if BCB Bancorp might be undervalued or overvalued with our detailed analysis, featuring fair value estimates, potential risks, dividends, insider trades, and its financial condition.
Access Free AnalysisHave feedback on this article? Concerned about the content? Get in touch with us directly. Alternatively, email editorial-team (at) simplywallst.com.
This article by Simply Wall St is general in nature. We provide commentary based on historical data and analyst forecasts only using an unbiased methodology and our articles are not intended to be financial advice. It does not constitute a recommendation to buy or sell any stock, and does not take account of your objectives, or your financial situation. We aim to bring you long-term focused analysis driven by fundamental data. Note that our analysis may not factor in the latest price-sensitive company announcements or qualitative material. Simply Wall St has no position in any stocks mentioned.
About NasdaqGM:BCBP
BCB Bancorp
Operates as a bank holding company for BCB Community Bank that engages in the provision of banking products and services to businesses and individuals in the United States.
Very undervalued 6 star dividend payer.

