
Advertisement
- United States
- /
- Auto
- /
- NYSE:XPEV
Further Upside For XPeng Inc. (NYSE:XPEV) Shares Could Introduce Price Risks After 29% Bounce
XPeng Inc. (NYSE:XPEV) shareholders would be excited to see that the share price has had a great month, posting a 29% gain and recovering from prior weakness. Not all shareholders will be feeling jubilant, since the share price is still down a very disappointing 49% in the last twelve months.
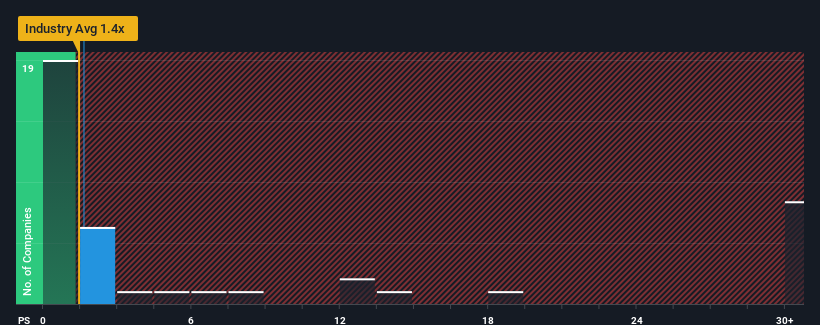
Although its price has surged higher, there still wouldn't be many who think XPeng's price-to-sales (or "P/S") ratio of 1.6x is worth a mention when the median P/S in the United States' Auto industry is similar at about 1.4x. Although, it's not wise to simply ignore the P/S without explanation as investors may be disregarding a distinct opportunity or a costly mistake.
See our latest analysis for XPeng
What Does XPeng's Recent Performance Look Like?
Recent times have been advantageous for XPeng as its revenues have been rising faster than most other companies. One possibility is that the P/S ratio is moderate because investors think this strong revenue performance might be about to tail off. If the company manages to stay the course, then investors should be rewarded with a share price that matches its revenue figures.
Keen to find out how analysts think XPeng's future stacks up against the industry? In that case, our free report is a great place to start.Is There Some Revenue Growth Forecasted For XPeng?
XPeng's P/S ratio would be typical for a company that's only expected to deliver moderate growth, and importantly, perform in line with the industry.
Retrospectively, the last year delivered an exceptional 72% gain to the company's top line. Pleasingly, revenue has also lifted 214% in aggregate from three years ago, thanks to the last 12 months of growth. Accordingly, shareholders would have definitely welcomed those medium-term rates of revenue growth.
Turning to the outlook, the next three years should generate growth of 29% per year as estimated by the analysts watching the company. With the industry only predicted to deliver 17% per annum, the company is positioned for a stronger revenue result.
With this information, we find it interesting that XPeng is trading at a fairly similar P/S compared to the industry. Apparently some shareholders are skeptical of the forecasts and have been accepting lower selling prices.
What We Can Learn From XPeng's P/S?
XPeng appears to be back in favour with a solid price jump bringing its P/S back in line with other companies in the industry Using the price-to-sales ratio alone to determine if you should sell your stock isn't sensible, however it can be a practical guide to the company's future prospects.
Despite enticing revenue growth figures that outpace the industry, XPeng's P/S isn't quite what we'd expect. When we see a strong revenue outlook, with growth outpacing the industry, we can only assume potential uncertainty around these figures are what might be placing slight pressure on the P/S ratio. At least the risk of a price drop looks to be subdued, but investors seem to think future revenue could see some volatility.
Before you settle on your opinion, we've discovered 1 warning sign for XPeng that you should be aware of.
It's important to make sure you look for a great company, not just the first idea you come across. So if growing profitability aligns with your idea of a great company, take a peek at this free list of interesting companies with strong recent earnings growth (and a low P/E).
New: AI Stock Screener & Alerts
Our new AI Stock Screener scans the market every day to uncover opportunities.
• Dividend Powerhouses (3%+ Yield)
• Undervalued Small Caps with Insider Buying
• High growth Tech and AI Companies
Or build your own from over 50 metrics.
Have feedback on this article? Concerned about the content? Get in touch with us directly. Alternatively, email editorial-team (at) simplywallst.com.
This article by Simply Wall St is general in nature. We provide commentary based on historical data and analyst forecasts only using an unbiased methodology and our articles are not intended to be financial advice. It does not constitute a recommendation to buy or sell any stock, and does not take account of your objectives, or your financial situation. We aim to bring you long-term focused analysis driven by fundamental data. Note that our analysis may not factor in the latest price-sensitive company announcements or qualitative material. Simply Wall St has no position in any stocks mentioned.
About NYSE:XPEV
XPeng
Designs, develops, manufactures, and markets smart electric vehicles (EVs) in the People’s Republic of China.
High growth potential with adequate balance sheet.
Similar Companies
Market Insights

Advertisement
Community Narratives
Nike's Direct-to-Consumer Focus Will Drive Future Growth
Fair Value US$87.90|18.2% undervalued
UN
Community Contributor
Novo Nordisk will dominate GLP-1 market with Ozempic and Wegovy growth
Fair Value US$89.59|12.1% undervalued
BE
Community Contributor
Rheinmetall could get 20-25% of EU-NATO 3%-GDP defence spending
Fair Value €7.57k|82.4% undervalued
NO
Community Contributor