

Key Insights
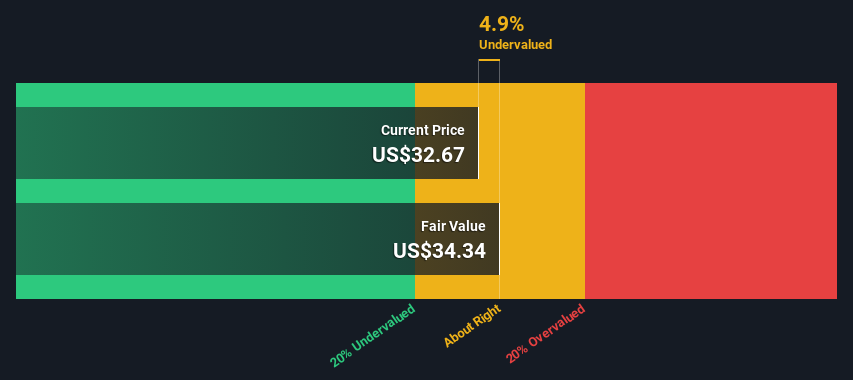
- Using the 2 Stage Free Cash Flow to Equity, Harley-Davidson fair value estimate is US$34.34
- Harley-Davidson's US$32.67 share price indicates it is trading at similar levels as its fair value estimate
- Our fair value estimate is 26% lower than Harley-Davidson's analyst price target of US$46.28
In this article we are going to estimate the intrinsic value of Harley-Davidson, Inc. (NYSE:HOG) by taking the expected future cash flows and discounting them to their present value. We will take advantage of the Discounted Cash Flow (DCF) model for this purpose. Models like these may appear beyond the comprehension of a lay person, but they're fairly easy to follow.
We would caution that there are many ways of valuing a company and, like the DCF, each technique has advantages and disadvantages in certain scenarios. For those who are keen learners of equity analysis, the Simply Wall St analysis model here may be something of interest to you.
See our latest analysis for Harley-Davidson
The Calculation
We're using the 2-stage growth model, which simply means we take in account two stages of company's growth. In the initial period the company may have a higher growth rate and the second stage is usually assumed to have a stable growth rate. To begin with, we have to get estimates of the next ten years of cash flows. Where possible we use analyst estimates, but when these aren't available we extrapolate the previous free cash flow (FCF) from the last estimate or reported value. We assume companies with shrinking free cash flow will slow their rate of shrinkage, and that companies with growing free cash flow will see their growth rate slow, over this period. We do this to reflect that growth tends to slow more in the early years than it does in later years.
A DCF is all about the idea that a dollar in the future is less valuable than a dollar today, so we need to discount the sum of these future cash flows to arrive at a present value estimate:
10-year free cash flow (FCF) forecast
| 2024 | 2025 | 2026 | 2027 | 2028 | 2029 | 2030 | 2031 | 2032 | 2033 | |
| Levered FCF ($, Millions) | US$727.2m | US$499.5m | US$557.9m | US$563.8m | US$538.4m | US$524.8m | US$519.0m | US$518.3m | US$521.2m | US$526.5m |
| Growth Rate Estimate Source | Analyst x3 | Analyst x1 | Analyst x1 | Analyst x1 | Est @ -4.51% | Est @ -2.51% | Est @ -1.11% | Est @ -0.13% | Est @ 0.55% | Est @ 1.03% |
| Present Value ($, Millions) Discounted @ 12% | US$648 | US$397 | US$396 | US$356 | US$303 | US$264 | US$233 | US$207 | US$186 | US$167 |
("Est" = FCF growth rate estimated by Simply Wall St)
Present Value of 10-year Cash Flow (PVCF) = US$3.2b
After calculating the present value of future cash flows in the initial 10-year period, we need to calculate the Terminal Value, which accounts for all future cash flows beyond the first stage. For a number of reasons a very conservative growth rate is used that cannot exceed that of a country's GDP growth. In this case we have used the 5-year average of the 10-year government bond yield (2.2%) to estimate future growth. In the same way as with the 10-year 'growth' period, we discount future cash flows to today's value, using a cost of equity of 12%.
Terminal Value (TV)= FCF2033 × (1 + g) ÷ (r – g) = US$527m× (1 + 2.2%) ÷ (12%– 2.2%) = US$5.4b
Present Value of Terminal Value (PVTV)= TV / (1 + r)10= US$5.4b÷ ( 1 + 12%)10= US$1.7b
The total value, or equity value, is then the sum of the present value of the future cash flows, which in this case is US$4.9b. To get the intrinsic value per share, we divide this by the total number of shares outstanding. Compared to the current share price of US$32.7, the company appears about fair value at a 4.9% discount to where the stock price trades currently. The assumptions in any calculation have a big impact on the valuation, so it is better to view this as a rough estimate, not precise down to the last cent.
Important Assumptions
Now the most important inputs to a discounted cash flow are the discount rate, and of course, the actual cash flows. You don't have to agree with these inputs, I recommend redoing the calculations yourself and playing with them. The DCF also does not consider the possible cyclicality of an industry, or a company's future capital requirements, so it does not give a full picture of a company's potential performance. Given that we are looking at Harley-Davidson as potential shareholders, the cost of equity is used as the discount rate, rather than the cost of capital (or weighted average cost of capital, WACC) which accounts for debt. In this calculation we've used 12%, which is based on a levered beta of 2.000. Beta is a measure of a stock's volatility, compared to the market as a whole. We get our beta from the industry average beta of globally comparable companies, with an imposed limit between 0.8 and 2.0, which is a reasonable range for a stable business.
SWOT Analysis for Harley-Davidson
- Earnings growth over the past year exceeded the industry.
- Debt is well covered by earnings.
- Dividends are covered by earnings and cash flows.
- Dividend is low compared to the top 25% of dividend payers in the Auto market.
- Good value based on P/E ratio and estimated fair value.
- Debt is not well covered by operating cash flow.
- Annual earnings are forecast to decline for the next 3 years.
Moving On:
Valuation is only one side of the coin in terms of building your investment thesis, and it shouldn't be the only metric you look at when researching a company. DCF models are not the be-all and end-all of investment valuation. Rather it should be seen as a guide to "what assumptions need to be true for this stock to be under/overvalued?" For instance, if the terminal value growth rate is adjusted slightly, it can dramatically alter the overall result. For Harley-Davidson, there are three important factors you should look at:
- Risks: We feel that you should assess the 3 warning signs for Harley-Davidson (2 can't be ignored!) we've flagged before making an investment in the company.
- Future Earnings: How does HOG's growth rate compare to its peers and the wider market? Dig deeper into the analyst consensus number for the upcoming years by interacting with our free analyst growth expectation chart.
- Other High Quality Alternatives: Do you like a good all-rounder? Explore our interactive list of high quality stocks to get an idea of what else is out there you may be missing!
PS. The Simply Wall St app conducts a discounted cash flow valuation for every stock on the NYSE every day. If you want to find the calculation for other stocks just search here.
Valuation is complex, but we're here to simplify it.
Discover if Harley-Davidson might be undervalued or overvalued with our detailed analysis, featuring fair value estimates, potential risks, dividends, insider trades, and its financial condition.
Access Free AnalysisHave feedback on this article? Concerned about the content? Get in touch with us directly. Alternatively, email editorial-team (at) simplywallst.com.
This article by Simply Wall St is general in nature. We provide commentary based on historical data and analyst forecasts only using an unbiased methodology and our articles are not intended to be financial advice. It does not constitute a recommendation to buy or sell any stock, and does not take account of your objectives, or your financial situation. We aim to bring you long-term focused analysis driven by fundamental data. Note that our analysis may not factor in the latest price-sensitive company announcements or qualitative material. Simply Wall St has no position in any stocks mentioned.
About NYSE:HOG
Harley-Davidson
Manufactures and sells motorcycles in the United States and internationally.
Good value with mediocre balance sheet.
Market Insights

Community Narratives

