- United States
- /
- Auto
- /
- NYSE:GM
Evaluating GM’s Stock in 2025 After Tariff Relief Talks and Recent Price Gains

Reviewed by Bailey Pemberton
If you own General Motors stock, or are thinking about jumping in, you are definitely not alone in weighing the possibilities. The past year has been a ride for GM investors, with the share price climbing 27.9% over the last 12 months, and a whopping 86.9% over the last five years. Even after a small pullback this week, with shares down 4.8%, many are wondering if that is just a breather or a signal to tread carefully. After all, as of the last close, the stock sits at $58.19, and the yearly return to date is still a healthy 13.3%.
What is driving all these moves? Part of the picture is the market’s shifting expectations, especially as headlines swirl about tariffs, government incentives, and big bets on electric vehicles. Some news, like chatter about the potential elimination of auto tariffs, is fueling optimism that GM could benefit from lower production costs. On the flipside, the mixed momentum in GM’s electric vehicle strategy and heated debates among Detroit automakers over government policies inject new risks, but perhaps also fresh opportunities for those willing to look past the noise.
When it comes to real value, though, the numbers are hard to ignore. GM scores a 5 out of 6 on key undervaluation checks, meaning it passes nearly every traditional test for an underpriced stock. Still, not all valuation methods are created equal. Let’s break down what these scores actually mean for investors, and then dig into an even smarter way to judge GM’s true worth.
Why General Motors is lagging behind its peers
Approach 1: General Motors Discounted Cash Flow (DCF) Analysis
The Discounted Cash Flow (DCF) model estimates a company’s intrinsic value by projecting its future cash flows and discounting them back to today’s dollars. This method tries to gauge what General Motors is truly worth based on the cash it is likely to generate in the coming years.
Currently, General Motors reports Free Cash Flow of $13.05 billion. Analyst projections suggest steady growth, with Free Cash Flow expected to reach $8.71 billion in 2029, and Simply Wall St extrapolates estimates out to 2035. Over the next decade, projected Free Cash Flow remains in the $7.1 to $11.0 billion range per year, signaling robust operational strength.
Applying the 2 Stage Free Cash Flow to Equity model, the DCF analysis pegs General Motors’ intrinsic value at $91.14 per share. Compared to the recent trading price of $58.19, this implies the stock is trading at a 36.2% discount, or in other words, is significantly undervalued according to this approach.
Result: UNDERVALUED
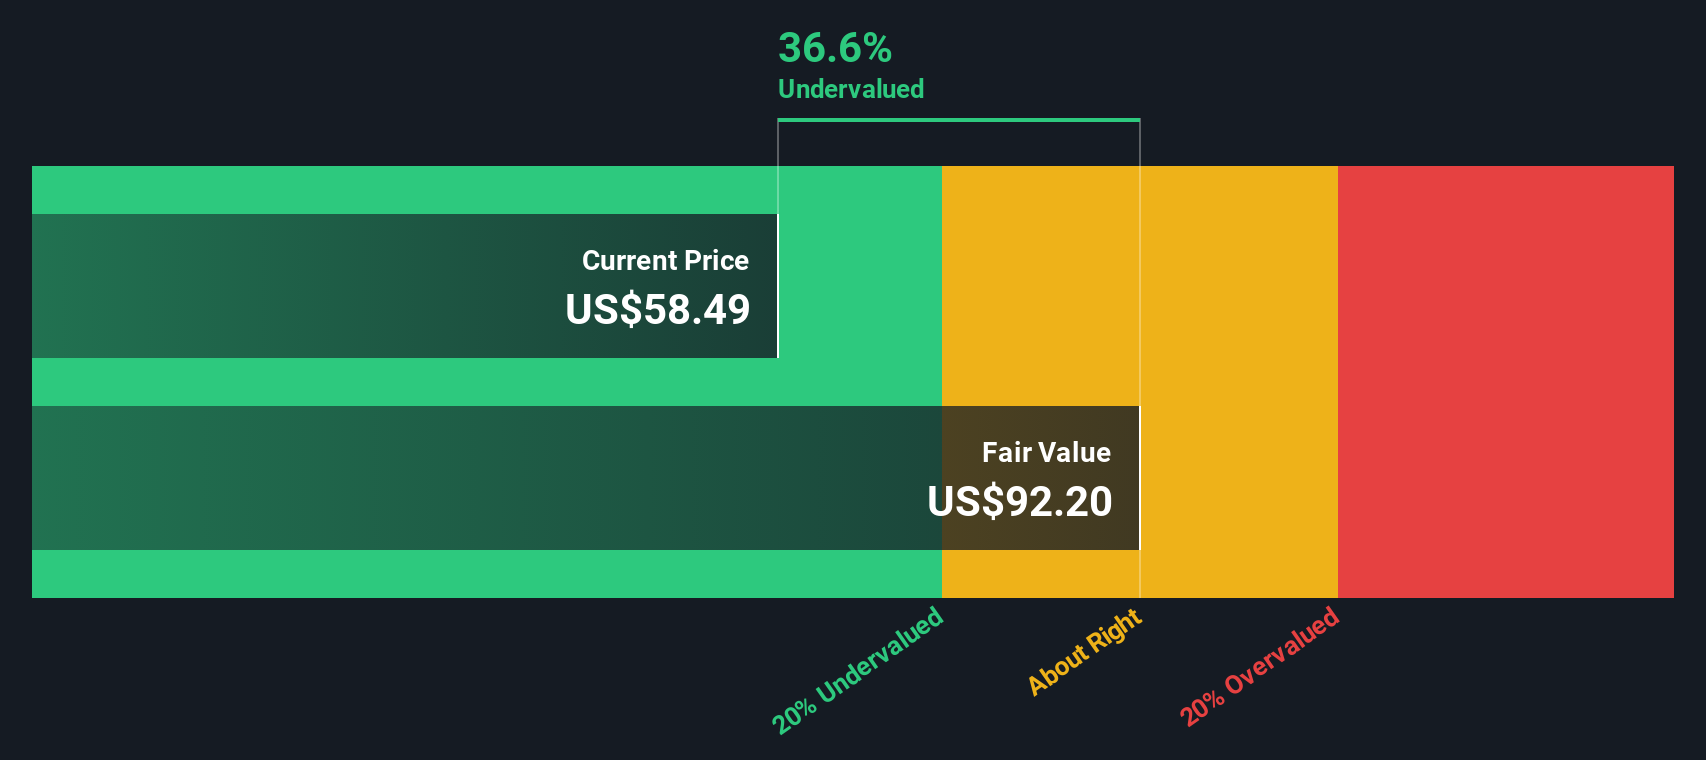
Our Discounted Cash Flow (DCF) analysis suggests General Motors is undervalued by 36.2%. Track this in your watchlist or portfolio, or discover more undervalued stocks.
Approach 2: General Motors Price vs Earnings
For profitable companies like General Motors, the price-to-earnings (PE) ratio is often the go-to metric for valuing a stock. The PE ratio reflects what investors are willing to pay for each dollar of a company’s earnings, making it a straightforward, familiar benchmark for assessing value. Of course, a “fair” PE isn’t just about profits. It is shaped by growth expectations and perceived business risks. Higher growth or lower risk typically justifies a higher PE ratio, while companies facing tougher prospects or industry disruption will often see lower ratios.
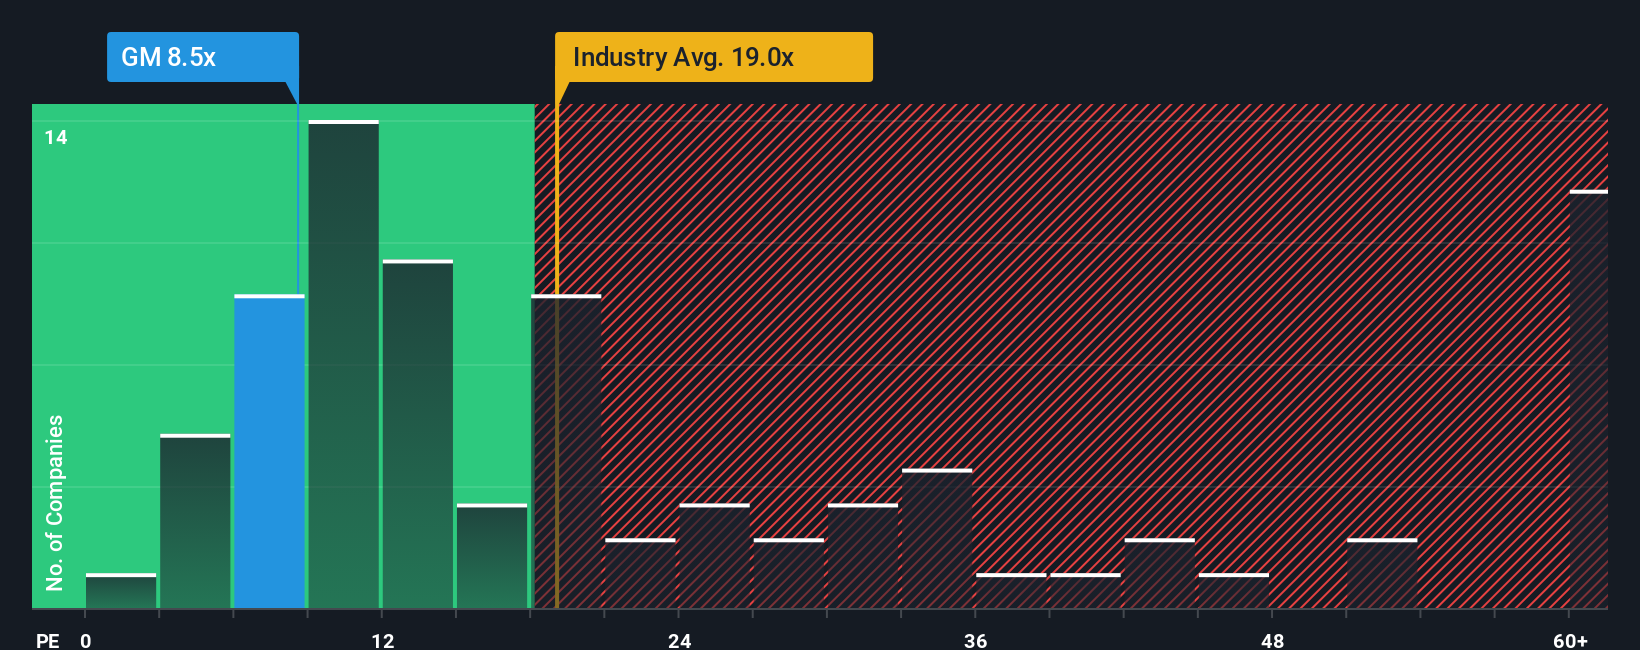
General Motors is currently trading at a PE of 8.5x. That is well below the auto industry average of 18.2x and a peer group average of 19.7x. At first glance, this low multiple might make GM seem like a bargain. But raw comparisons can be misleading. A slow-grower or a company facing bigger risks deserves a lower PE, while an industry leader with strong future prospects merits a premium.
This is where Simply Wall St’s Fair Ratio comes in. The Fair Ratio blends factors like profit margins, growth, industry trends, risk profile, and market cap to estimate a PE ratio tailored to General Motors’ real situation. For GM, the Fair Ratio is 15.2x, which is almost double its current PE. Because this takes all the relevant nuances into account, it provides a more balanced view than basic industry or peer benchmarks. Looking at the gap between GM’s actual PE and its Fair Ratio, there is a strong case the stock is undervalued based on its earnings potential.
Result: UNDERVALUED
PE ratios tell one story, but what if the real opportunity lies elsewhere? Discover companies where insiders are betting big on explosive growth.
Upgrade Your Decision Making: Choose your General Motors Narrative
Earlier we mentioned that there is an even better way to understand valuation, so let’s introduce you to Narratives. A Narrative is your personal story or perspective about where a company like General Motors is headed, connecting your assumptions about its future revenue, margins, and risks to a fair value estimate. In essence, it translates your insights into actionable numbers.
Narratives simplify investment decisions by letting you create, update, and track your forecasts within the Simply Wall St Community page, a feature used by millions of investors. This tool helps you judge whether to buy or sell by comparing your calculated Fair Value to the current market Price, making it easy to see when your story signals opportunity or caution.
Plus, Narratives automatically update as new data or news arrives, so your outlook stays fresh and informed. For example, if you believe General Motors will rapidly gain EV market share, your Narrative might reflect higher future earnings and a bullish fair value. In contrast, a more cautious investor could set a lower target based on slower growth or persistent risks.
No matter your view, Narratives put your investment thesis into numbers, giving you a smarter and more dynamic way to invest.
Do you think there's more to the story for General Motors? Create your own Narrative to let the Community know!

This article by Simply Wall St is general in nature. We provide commentary based on historical data and analyst forecasts only using an unbiased methodology and our articles are not intended to be financial advice. It does not constitute a recommendation to buy or sell any stock, and does not take account of your objectives, or your financial situation. We aim to bring you long-term focused analysis driven by fundamental data. Note that our analysis may not factor in the latest price-sensitive company announcements or qualitative material. Simply Wall St has no position in any stocks mentioned.
The New Payments ETF Is Live on NASDAQ:
Money is moving to real-time rails, and a newly listed ETF now gives investors direct exposure. Fast settlement. Institutional custody. Simple access.
Explore how this launch could reshape portfolios
Sponsored ContentNew: Manage All Your Stock Portfolios in One Place
We've created the ultimate portfolio companion for stock investors, and it's free.
• Connect an unlimited number of Portfolios and see your total in one currency
• Be alerted to new Warning Signs or Risks via email or mobile
• Track the Fair Value of your stocks
Have feedback on this article? Concerned about the content? Get in touch with us directly. Alternatively, email editorial-team@simplywallst.com
About NYSE:GM
General Motors
Designs, builds, and sells trucks, crossovers, cars, and automobile parts worldwide.
Good value with slight risk.
Similar Companies
Market Insights


Weekly Picks

Early mover in a fast growing industry. Likely to experience share price volatility as they scale


A case for CA$31.80 (undiluted), aka 8,616% upside from CA$0.37 (an 86 bagger!).


Moderation and Stabilisation: HOLD: Fair Price based on a 4-year Cycle is $12.08
Recently Updated Narratives

Automotive Electronics Manufacturer Consistent and Stable

Airbnb Stock: Platform Growth in a World of Saturation and Scrutiny

Adobe Stock: AI-Fueled ARR Growth Pushes Guidance Higher, But Cost Pressures Loom
Popular Narratives


Crazy Undervalued 42 Baggers Silver Play (Active & Running Mine)


NVDA: Expanding AI Demand Will Drive Major Data Center Investments Through 2026

The AI Infrastructure Giant Grows Into Its Valuation
Trending Discussion


