Johnson Health Tech .Co's (TWSE:1736) 24% CAGR outpaced the company's earnings growth over the same three-year period


One simple way to benefit from the stock market is to buy an index fund. But if you buy good businesses at attractive prices, your portfolio returns could exceed the average market return. For example, Johnson Health Tech .Co., Ltd. (TWSE:1736) shareholders have seen the share price rise 84% over three years, well in excess of the market return (30%, not including dividends). On the other hand, the returns haven't been quite so good recently, with shareholders up just 65%, including dividends.
Since the stock has added NT$2.6b to its market cap in the past week alone, let's see if underlying performance has been driving long-term returns.
See our latest analysis for Johnson Health Tech .Co
While markets are a powerful pricing mechanism, share prices reflect investor sentiment, not just underlying business performance. One way to examine how market sentiment has changed over time is to look at the interaction between a company's share price and its earnings per share (EPS).
Johnson Health Tech .Co was able to grow its EPS at 5.2% per year over three years, sending the share price higher. In comparison, the 23% per year gain in the share price outpaces the EPS growth. This suggests that, as the business progressed over the last few years, it gained the confidence of market participants. It is quite common to see investors become enamoured with a business, after a few years of solid progress.
The image below shows how EPS has tracked over time (if you click on the image you can see greater detail).
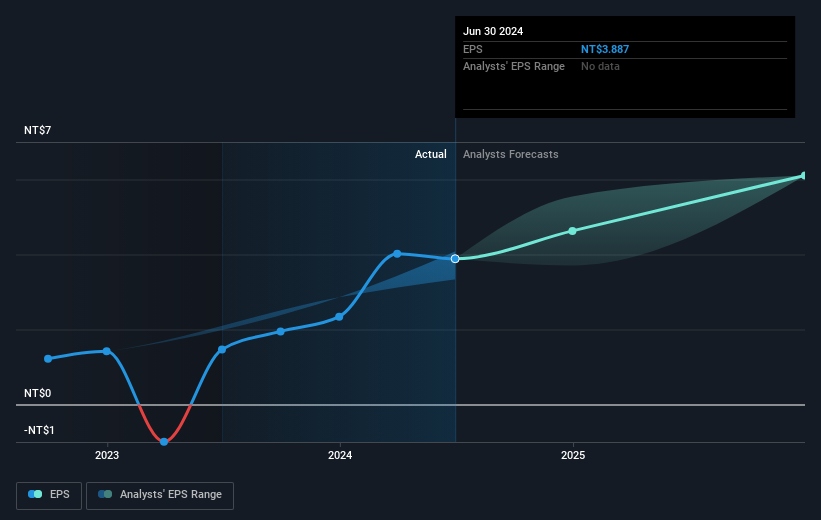
We know that Johnson Health Tech .Co has improved its bottom line lately, but is it going to grow revenue? You could check out this free report showing analyst revenue forecasts.
What About Dividends?
As well as measuring the share price return, investors should also consider the total shareholder return (TSR). Whereas the share price return only reflects the change in the share price, the TSR includes the value of dividends (assuming they were reinvested) and the benefit of any discounted capital raising or spin-off. Arguably, the TSR gives a more comprehensive picture of the return generated by a stock. We note that for Johnson Health Tech .Co the TSR over the last 3 years was 92%, which is better than the share price return mentioned above. The dividends paid by the company have thusly boosted the total shareholder return.
A Different Perspective
It's good to see that Johnson Health Tech .Co has rewarded shareholders with a total shareholder return of 65% in the last twelve months. That's including the dividend. Since the one-year TSR is better than the five-year TSR (the latter coming in at 8% per year), it would seem that the stock's performance has improved in recent times. Given the share price momentum remains strong, it might be worth taking a closer look at the stock, lest you miss an opportunity. It's always interesting to track share price performance over the longer term. But to understand Johnson Health Tech .Co better, we need to consider many other factors. Consider risks, for instance. Every company has them, and we've spotted 2 warning signs for Johnson Health Tech .Co you should know about.
For those who like to find winning investments this free list of undervalued companies with recent insider purchasing, could be just the ticket.
Please note, the market returns quoted in this article reflect the market weighted average returns of stocks that currently trade on Taiwanese exchanges.
New: Manage All Your Stock Portfolios in One Place
We've created the ultimate portfolio companion for stock investors, and it's free.
• Connect an unlimited number of Portfolios and see your total in one currency
• Be alerted to new Warning Signs or Risks via email or mobile
• Track the Fair Value of your stocks
Have feedback on this article? Concerned about the content? Get in touch with us directly. Alternatively, email editorial-team (at) simplywallst.com.
This article by Simply Wall St is general in nature. We provide commentary based on historical data and analyst forecasts only using an unbiased methodology and our articles are not intended to be financial advice. It does not constitute a recommendation to buy or sell any stock, and does not take account of your objectives, or your financial situation. We aim to bring you long-term focused analysis driven by fundamental data. Note that our analysis may not factor in the latest price-sensitive company announcements or qualitative material. Simply Wall St has no position in any stocks mentioned.
About TWSE:1736
Johnson Health Tech .Co
Johnson Health Tech. Co., Ltd. engages in the manufacture and sale of sports and fitness equipment in the Americas, Europe, Asia, and internationally.
High growth potential with proven track record.

