Earnings growth outpaced the notable 33% return delivered to Fraser and Neave (SGX:F99) shareholders over the last year


If you want to compound wealth in the stock market, you can do so by buying an index fund. But if you pick the right individual stocks, you could make more than that. For example, the Fraser and Neave, Limited (SGX:F99) share price is up 27% in the last 1 year, clearly besting the market return of around 8.7% (not including dividends). That's a solid performance by our standards! Unfortunately the longer term returns are not so good, with the stock falling 4.3% in the last three years.
The past week has proven to be lucrative for Fraser and Neave investors, so let's see if fundamentals drove the company's one-year performance.
View our latest analysis for Fraser and Neave
To paraphrase Benjamin Graham: Over the short term the market is a voting machine, but over the long term it's a weighing machine. By comparing earnings per share (EPS) and share price changes over time, we can get a feel for how investor attitudes to a company have morphed over time.
During the last year Fraser and Neave grew its earnings per share (EPS) by 40%. This EPS growth is significantly higher than the 27% increase in the share price. Therefore, it seems the market isn't as excited about Fraser and Neave as it was before. This could be an opportunity. This cautious sentiment is reflected in its (fairly low) P/E ratio of 11.62.
The graphic below depicts how EPS has changed over time (unveil the exact values by clicking on the image).
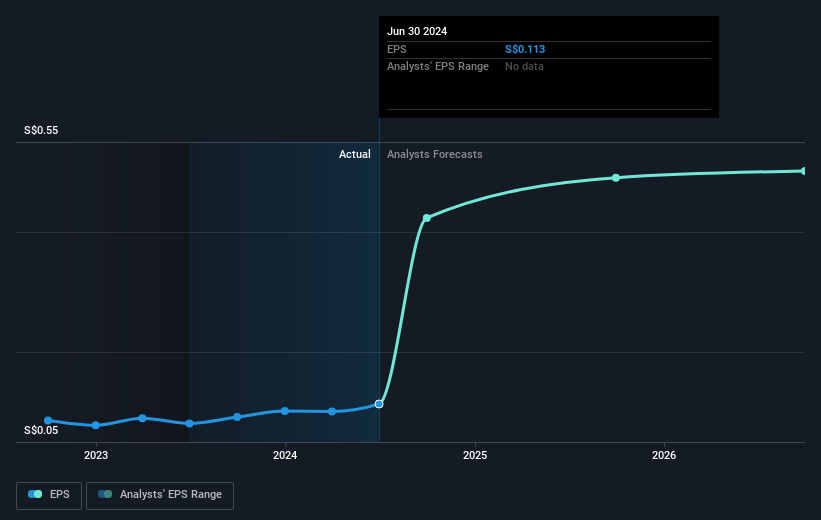
We know that Fraser and Neave has improved its bottom line lately, but is it going to grow revenue? This free report showing analyst revenue forecasts should help you figure out if the EPS growth can be sustained.
What About Dividends?
It is important to consider the total shareholder return, as well as the share price return, for any given stock. The TSR is a return calculation that accounts for the value of cash dividends (assuming that any dividend received was reinvested) and the calculated value of any discounted capital raisings and spin-offs. It's fair to say that the TSR gives a more complete picture for stocks that pay a dividend. As it happens, Fraser and Neave's TSR for the last 1 year was 33%, which exceeds the share price return mentioned earlier. This is largely a result of its dividend payments!
A Different Perspective
It's good to see that Fraser and Neave has rewarded shareholders with a total shareholder return of 33% in the last twelve months. That's including the dividend. There's no doubt those recent returns are much better than the TSR loss of 1.2% per year over five years. We generally put more weight on the long term performance over the short term, but the recent improvement could hint at a (positive) inflection point within the business. It's always interesting to track share price performance over the longer term. But to understand Fraser and Neave better, we need to consider many other factors. For example, we've discovered 1 warning sign for Fraser and Neave that you should be aware of before investing here.
If you are like me, then you will not want to miss this free list of undervalued small caps that insiders are buying.
Please note, the market returns quoted in this article reflect the market weighted average returns of stocks that currently trade on Singaporean exchanges.
If you're looking to trade Fraser and Neave, open an account with the lowest-cost platform trusted by professionals, Interactive Brokers.
With clients in over 200 countries and territories, and access to 160 markets, IBKR lets you trade stocks, options, futures, forex, bonds and funds from a single integrated account.
Enjoy no hidden fees, no account minimums, and FX conversion rates as low as 0.03%, far better than what most brokers offer.
Sponsored ContentNew: AI Stock Screener & Alerts
Our new AI Stock Screener scans the market every day to uncover opportunities.
• Dividend Powerhouses (3%+ Yield)
• Undervalued Small Caps with Insider Buying
• High growth Tech and AI Companies
Or build your own from over 50 metrics.
Have feedback on this article? Concerned about the content? Get in touch with us directly. Alternatively, email editorial-team (at) simplywallst.com.
This article by Simply Wall St is general in nature. We provide commentary based on historical data and analyst forecasts only using an unbiased methodology and our articles are not intended to be financial advice. It does not constitute a recommendation to buy or sell any stock, and does not take account of your objectives, or your financial situation. We aim to bring you long-term focused analysis driven by fundamental data. Note that our analysis may not factor in the latest price-sensitive company announcements or qualitative material. Simply Wall St has no position in any stocks mentioned.
About SGX:F99
Fraser and Neave
Engages in the food and beverage, and publishing and printing businesses in Singapore, Malaysia, Thailand, Vietnam, and internationally.
Adequate balance sheet average dividend payer.
Market Insights

Community Narratives


