
Advertisement
These 4 Measures Indicate That Cint Group (STO:CINT) Is Using Debt Extensively
Legendary fund manager Li Lu (who Charlie Munger backed) once said, 'The biggest investment risk is not the volatility of prices, but whether you will suffer a permanent loss of capital.' So it might be obvious that you need to consider debt, when you think about how risky any given stock is, because too much debt can sink a company. Importantly, Cint Group AB (publ) (STO:CINT) does carry debt. But is this debt a concern to shareholders?
When Is Debt A Problem?
Debt assists a business until the business has trouble paying it off, either with new capital or with free cash flow. Part and parcel of capitalism is the process of 'creative destruction' where failed businesses are mercilessly liquidated by their bankers. However, a more common (but still painful) scenario is that it has to raise new equity capital at a low price, thus permanently diluting shareholders. Of course, debt can be an important tool in businesses, particularly capital heavy businesses. The first thing to do when considering how much debt a business uses is to look at its cash and debt together.
What Is Cint Group's Debt?
The image below, which you can click on for greater detail, shows that Cint Group had debt of €56.6m at the end of September 2025, a reduction from €99.3m over a year. However, because it has a cash reserve of €50.4m, its net debt is less, at about €6.19m.
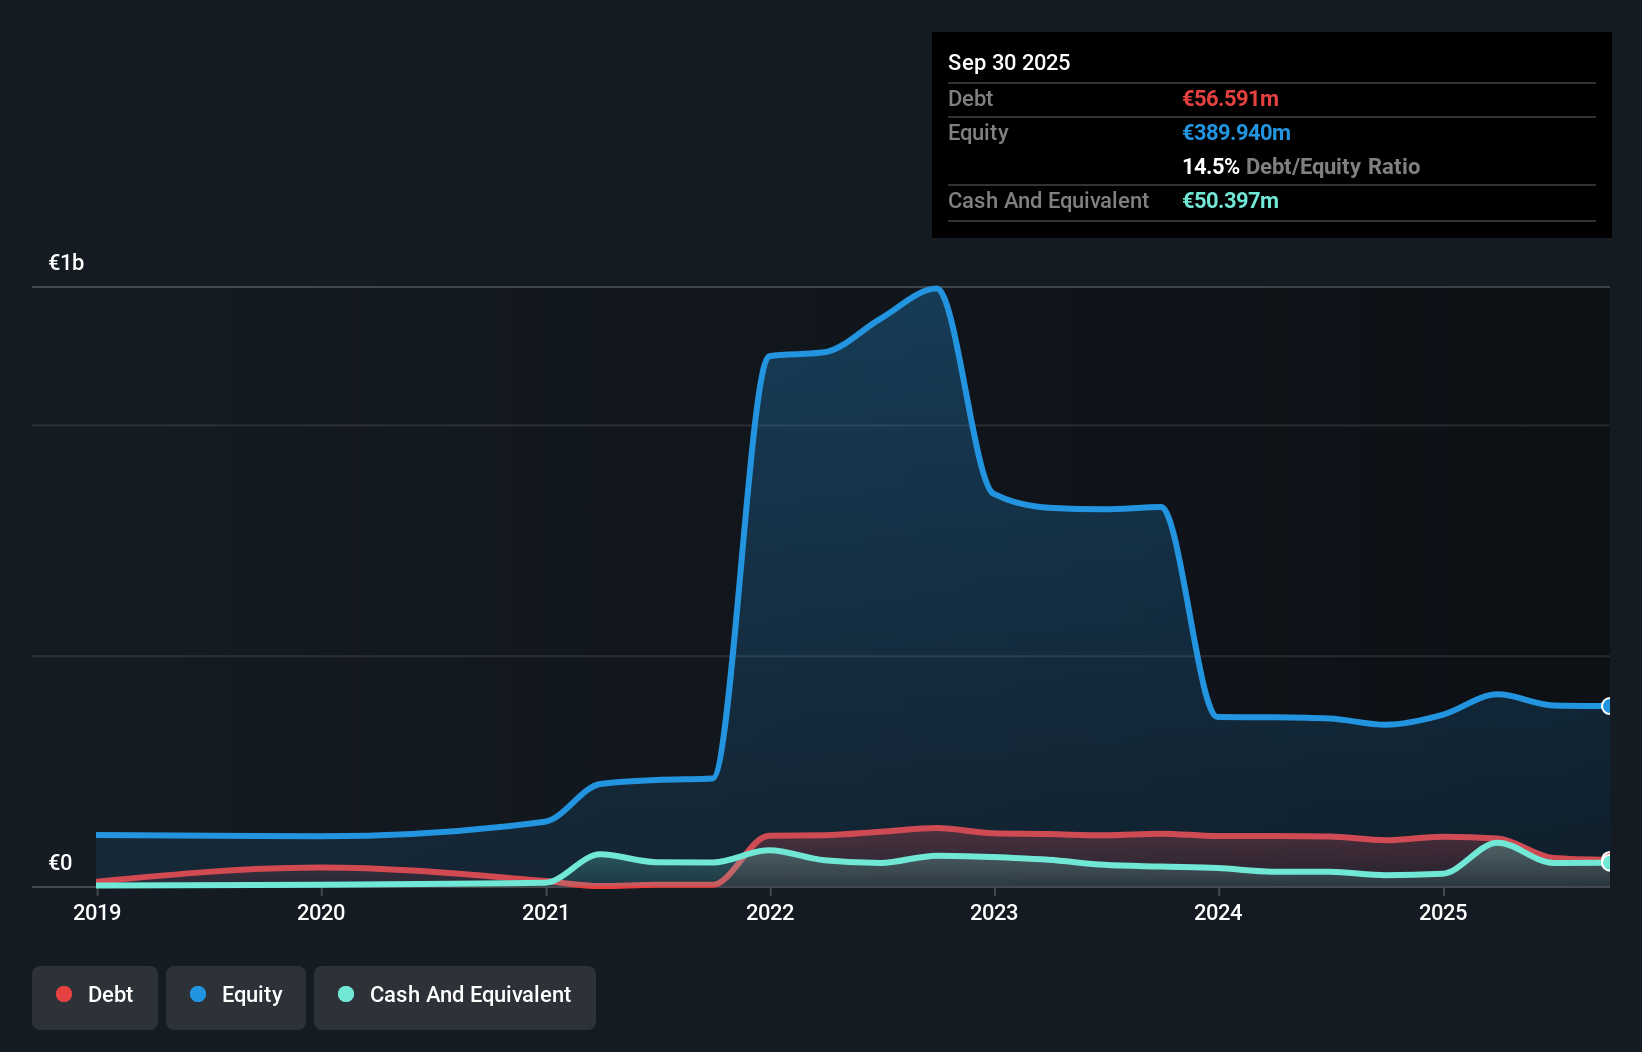
How Strong Is Cint Group's Balance Sheet?
The latest balance sheet data shows that Cint Group had liabilities of €77.3m due within a year, and liabilities of €86.0m falling due after that. Offsetting these obligations, it had cash of €50.4m as well as receivables valued at €83.7m due within 12 months. So its liabilities outweigh the sum of its cash and (near-term) receivables by €29.3m.
Cint Group has a market capitalization of €105.3m, so it could very likely raise cash to ameliorate its balance sheet, if the need arose. However, it is still worthwhile taking a close look at its ability to pay off debt.
See our latest analysis for Cint Group
We measure a company's debt load relative to its earnings power by looking at its net debt divided by its earnings before interest, tax, depreciation, and amortization (EBITDA) and by calculating how easily its earnings before interest and tax (EBIT) cover its interest expense (interest cover). Thus we consider debt relative to earnings both with and without depreciation and amortization expenses.
Cint Group has a very low debt to EBITDA ratio of 0.48 so it is strange to see weak interest coverage, with last year's EBIT being only 0.45 times the interest expense. So one way or the other, it's clear the debt levels are not trivial. Importantly, Cint Group's EBIT fell a jaw-dropping 78% in the last twelve months. If that earnings trend continues then paying off its debt will be about as easy as herding cats on to a roller coaster. The balance sheet is clearly the area to focus on when you are analysing debt. But it is future earnings, more than anything, that will determine Cint Group's ability to maintain a healthy balance sheet going forward. So if you're focused on the future you can check out this free report showing analyst profit forecasts.
Finally, a company can only pay off debt with cold hard cash, not accounting profits. So the logical step is to look at the proportion of that EBIT that is matched by actual free cash flow. In the last two years, Cint Group's free cash flow amounted to 21% of its EBIT, less than we'd expect. That's not great, when it comes to paying down debt.
Our View
On the face of it, Cint Group's interest cover left us tentative about the stock, and its EBIT growth rate was no more enticing than the one empty restaurant on the busiest night of the year. But at least it's pretty decent at managing its debt, based on its EBITDA,; that's encouraging. Once we consider all the factors above, together, it seems to us that Cint Group's debt is making it a bit risky. That's not necessarily a bad thing, but we'd generally feel more comfortable with less leverage. There's no doubt that we learn most about debt from the balance sheet. However, not all investment risk resides within the balance sheet - far from it. We've identified 5 warning signs with Cint Group (at least 2 which are a bit concerning) , and understanding them should be part of your investment process.
If you're interested in investing in businesses that can grow profits without the burden of debt, then check out this free list of growing businesses that have net cash on the balance sheet.
New: AI Stock Screener & Alerts
Our new AI Stock Screener scans the market every day to uncover opportunities.
• Dividend Powerhouses (3%+ Yield)
• Undervalued Small Caps with Insider Buying
• High growth Tech and AI Companies
Or build your own from over 50 metrics.
Have feedback on this article? Concerned about the content? Get in touch with us directly. Alternatively, email editorial-team (at) simplywallst.com.
This article by Simply Wall St is general in nature. We provide commentary based on historical data and analyst forecasts only using an unbiased methodology and our articles are not intended to be financial advice. It does not constitute a recommendation to buy or sell any stock, and does not take account of your objectives, or your financial situation. We aim to bring you long-term focused analysis driven by fundamental data. Note that our analysis may not factor in the latest price-sensitive company announcements or qualitative material. Simply Wall St has no position in any stocks mentioned.
About OM:CINT
Cint Group
Operates as a research and measurement technology in the Americas, Europe, the Middle East, Africa, and the Asia Pacific.
Undervalued with excellent balance sheet.
Market Insights


Advertisement
Weekly Picks
CE


Ceazar on Sparc AI ·
When GPS fails: this small cap is fixing a $54B drone problem
Fair Value:CA$5.2533.3% undervalued
158 followersusers have followed this narrative
0 commentsusers have commented on this narrative
27 likesusers have liked this narrative
HA


HarishPK on Amdocs ·
Why Amdocs is a high conviction Buy for me?
Fair Value:US$82.0328.6% undervalued
35 followersusers have followed this narrative
3 commentsusers have commented on this narrative
12 likesusers have liked this narrative
IV

Ivoed on SBM Offshore ·
Why SBM Offshore’s €30 Share Price May Be Too Harsh On Its Backlog
Fair Value:€44.527.2% undervalued
19 followersusers have followed this narrative
0 commentsusers have commented on this narrative
5 likesusers have liked this narrative
CL


Clive_Thompson on Green Tea Group ·
One of China's Fastest-Growing Restaurant Chains Trades on Just 7x Earnings and an 8% Dividend
Fair Value:HK$8.723.9% undervalued
47 followersusers have followed this narrative
3 commentsusers have commented on this narrative
20 likesusers have liked this narrative
Recently Updated Narratives
RO


RockeTeller on Southern Silver Exploration ·
302 Million Oz Silver Project in Mexico: Low Cost Underground Giant Ready to Explode
Fair Value:CA$32.198.0% undervalued
5 followersusers have followed this narrative
0 commentsusers have commented on this narrative
0 likesusers have liked this narrative
J_


J_Tyrader on Oscar Health ·
7/8/26 — Oscar Health: Trading 95.4% below Fair Value with +2070.2% Upside Potential
Fair Value:US$583.3495.2% undervalued
5 followersusers have followed this narrative
0 commentsusers have commented on this narrative
0 likesusers have liked this narrative
AN


andre_santos on Procter & Gamble ·
Procter & Gamble - A Fundamental Valuation
Fair Value:US$107.5235.6% overvalued
26 followersusers have followed this narrative
2 commentsusers have commented on this narrative
0 likesusers have liked this narrative
Popular Narratives
OS


oscargarcia on NVIDIA ·
The company that went from selling GPUs to gamers to becoming the AI arms dealer of the 21st century.
Fair Value:US$28020.0% undervalued
277 followersusers have followed this narrative
9 commentsusers have commented on this narrative
16 likesusers have liked this narrative
CU

CubanEros on Microsoft ·
A wonderful business at reasonable price.
Fair Value:US$419.9119.1% overvalued
141 followersusers have followed this narrative
0 commentsusers have commented on this narrative
8 likesusers have liked this narrative
KI

KiwiInvest on Amazon.com ·
Amazon's high growth, high tech segments propel its profits, while traditional segments plod along
Fair Value:US$475.0942.2% undervalued
165 followersusers have followed this narrative
1 commentusers have commented on this narrative
8 likesusers have liked this narrative
Trending Discussion
YA


Yash_Upadhyaya on Reddit ·
Steve blamed "choppy" Google referral traffic for the miss on US daily active user (DAU) WHILST being in a standoff with Google on the AI licensing deal... hmm 🤔 One way or another a deal is happening. What's gonna be interesting is to see how good or bad (which the market is pricing in) would it be. PS - I don't own the stock but like the company.
1
|0
