Checkin.Com Group AB (publ) (STO:CHECK) Is Going Strong But Fundamentals Appear To Be Mixed : Is There A Clear Direction For The Stock?

Checkin.Com Group (STO:CHECK) has had a great run on the share market with its stock up by a significant 10% over the last week. However, we decided to pay attention to the company's fundamentals which don't appear to give a clear sign about the company's financial health. Particularly, we will be paying attention to Checkin.Com Group's ROE today.
Return on equity or ROE is a key measure used to assess how efficiently a company's management is utilizing the company's capital. In other words, it is a profitability ratio which measures the rate of return on the capital provided by the company's shareholders.
View our latest analysis for Checkin.Com Group
How Is ROE Calculated?
The formula for return on equity is:
Return on Equity = Net Profit (from continuing operations) ÷ Shareholders' Equity
So, based on the above formula, the ROE for Checkin.Com Group is:
0.7% = kr1.5m ÷ kr211m (Based on the trailing twelve months to September 2023).
The 'return' is the income the business earned over the last year. Another way to think of that is that for every SEK1 worth of equity, the company was able to earn SEK0.01 in profit.
What Is The Relationship Between ROE And Earnings Growth?
Thus far, we have learned that ROE measures how efficiently a company is generating its profits. Based on how much of its profits the company chooses to reinvest or "retain", we are then able to evaluate a company's future ability to generate profits. Assuming all else is equal, companies that have both a higher return on equity and higher profit retention are usually the ones that have a higher growth rate when compared to companies that don't have the same features.
Checkin.Com Group's Earnings Growth And 0.7% ROE
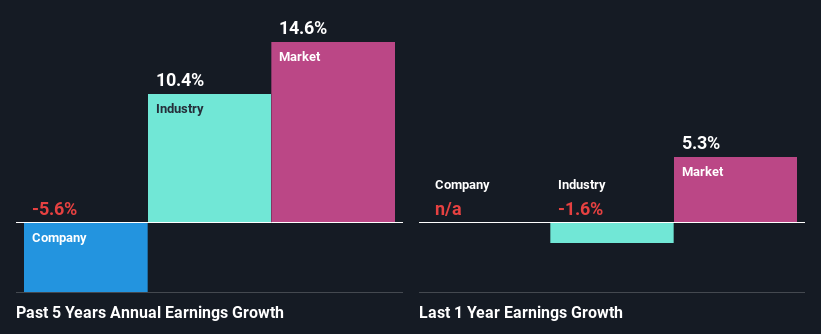
As you can see, Checkin.Com Group's ROE looks pretty weak. Even when compared to the industry average of 6.6%, the ROE figure is pretty disappointing. Given the circumstances, the significant decline in net income by 5.6% seen by Checkin.Com Group over the last five years is not surprising. However, there could also be other factors causing the earnings to decline. For example, the business has allocated capital poorly, or that the company has a very high payout ratio.
However, when we compared Checkin.Com Group's growth with the industry we found that while the company's earnings have been shrinking, the industry has seen an earnings growth of 10% in the same period. This is quite worrisome.
The basis for attaching value to a company is, to a great extent, tied to its earnings growth. It’s important for an investor to know whether the market has priced in the company's expected earnings growth (or decline). By doing so, they will have an idea if the stock is headed into clear blue waters or if swampy waters await. Is Checkin.Com Group fairly valued compared to other companies? These 3 valuation measures might help you decide.
Is Checkin.Com Group Efficiently Re-investing Its Profits?
Because Checkin.Com Group doesn't pay any dividends, we infer that it is retaining all of its profits, which is rather perplexing when you consider the fact that there is no earnings growth to show for it. So there could be some other explanations in that regard. For instance, the company's business may be deteriorating.
Conclusion
Overall, we have mixed feelings about Checkin.Com Group. While the company does have a high rate of reinvestment, the low ROE means that all that reinvestment is not reaping any benefit to its investors, and moreover, its having a negative impact on the earnings growth. Having said that, looking at current analyst estimates, we found that the company's earnings growth rate is expected to see a huge improvement. Are these analysts expectations based on the broad expectations for the industry, or on the company's fundamentals? Click here to be taken to our analyst's forecasts page for the company.
Mobile Infrastructure for Defense and Disaster
The next wave in robotics isn't humanoid. Its fully autonomous towers delivering 5G, ISR, and radar in under 30 minutes, anywhere.
Get the investor briefing before the next round of contracts
Sponsored On Behalf of CiTechNew: AI Stock Screener & Alerts
Our new AI Stock Screener scans the market every day to uncover opportunities.
• Dividend Powerhouses (3%+ Yield)
• Undervalued Small Caps with Insider Buying
• High growth Tech and AI Companies
Or build your own from over 50 metrics.
Have feedback on this article? Concerned about the content? Get in touch with us directly. Alternatively, email editorial-team (at) simplywallst.com.
This article by Simply Wall St is general in nature. We provide commentary based on historical data and analyst forecasts only using an unbiased methodology and our articles are not intended to be financial advice. It does not constitute a recommendation to buy or sell any stock, and does not take account of your objectives, or your financial situation. We aim to bring you long-term focused analysis driven by fundamental data. Note that our analysis may not factor in the latest price-sensitive company announcements or qualitative material. Simply Wall St has no position in any stocks mentioned.
About OM:CHECK
Checkin.Com Group
Develops software as a service that allow its consumers to connect with brands and services online in Sweden and internationally.
Excellent balance sheet and good value.
Market Insights

Weekly Picks

THE KINGDOM OF BROWN GOODS: WHY MGPI IS BEING CRUSHED BY INVENTORY & PRIMED FOR RESURRECTION


Why Vertical Aerospace (NYSE: EVTL) is Worth Possibly Over 13x its Current Price


The Quiet Giant That Became AI’s Power Grid
Recently Updated Narratives


A case for USD $14.81 per share based on book value. Be warned, this is a micro-cap dependent on a single mine.

Occidental Petroleum to Become Fairly Priced at $68.29 According to Future Projections

Agfa-Gevaert is a digital and materials turnaround opportunity, with growth potential in ZIRFON, but carrying legacy risks.
Popular Narratives


MicroVision will explode future revenue by 380.37% with a vision towards success


Crazy Undervalued 42 Baggers Silver Play (Active & Running Mine)


