- Poland
- /
- Real Estate
- /
- WSE:RNK
European Penny Stocks To Watch In September 2025

Reviewed by Simply Wall St
The European markets have been navigating a challenging landscape, with the STOXX Europe 600 Index declining amid concerns over U.S. Federal Reserve independence and geopolitical tensions. Despite these broader market pressures, penny stocks continue to offer intriguing opportunities for investors seeking growth potential at lower price points. While the term "penny stocks" may seem outdated, it remains relevant for highlighting smaller or newer companies that can provide value when paired with strong financial health and solid fundamentals.
Top 10 Penny Stocks In Europe
| Name | Share Price | Market Cap | Rewards & Risks |
| Ariston Holding (BIT:ARIS) | €4.174 | €1.44B | ✅ 5 ⚠️ 2 View Analysis > |
| Maps (BIT:MAPS) | €3.34 | €44.36M | ✅ 4 ⚠️ 2 View Analysis > |
| Angler Gaming (NGM:ANGL) | SEK3.60 | SEK269.95M | ✅ 4 ⚠️ 2 View Analysis > |
| Angler Gaming (DB:0QM) | €0.37 | €261.7M | ✅ 2 ⚠️ 2 View Analysis > |
| IAMBA Arad (BVB:FERO) | RON0.46 | RON16.91M | ✅ 2 ⚠️ 4 View Analysis > |
| Cellularline (BIT:CELL) | €3.16 | €66.65M | ✅ 4 ⚠️ 2 View Analysis > |
| ForFarmers (ENXTAM:FFARM) | €4.525 | €399.94M | ✅ 4 ⚠️ 1 View Analysis > |
| High (ENXTPA:HCO) | €3.52 | €69.19M | ✅ 1 ⚠️ 4 View Analysis > |
| Deceuninck (ENXTBR:DECB) | €2.095 | €289.57M | ✅ 4 ⚠️ 1 View Analysis > |
| Netgem (ENXTPA:ALNTG) | €0.946 | €31.9M | ✅ 4 ⚠️ 2 View Analysis > |
Click here to see the full list of 327 stocks from our European Penny Stocks screener.
Here's a peek at a few of the choices from the screener.
Aspocomp Group Oyj (HLSE:ACG1V)
Simply Wall St Financial Health Rating: ★★★★☆☆
Overview: Aspocomp Group Oyj manufactures and sells printed circuit boards (PCBs) in Finland, Europe, and internationally, with a market cap of €32.47 million.
Operations: The company's revenue is primarily generated from its High-Tech PCB Trading Services, amounting to €34.74 million.
Market Cap: €32.47M
Aspocomp Group Oyj has recently turned profitable, with earnings now forecasted to grow at 34.59% annually, a promising sign for investors interested in penny stocks. The company's revenue from High-Tech PCB Trading Services stands at €34.74 million, indicating solid business operations despite past challenges. While the net debt to equity ratio is satisfactory at 23.9%, operating cash flow covers only 17.2% of its debt, suggesting some financial constraints. Recent management changes include the appointment of Terhi Launis as CFO, which may influence future financial strategies and stability as Aspocomp aims for significant sales growth in 2025.
- Click here to discover the nuances of Aspocomp Group Oyj with our detailed analytical financial health report.
- Gain insights into Aspocomp Group Oyj's outlook and expected performance with our report on the company's earnings estimates.
Transferator (NGM:TRAN A)
Simply Wall St Financial Health Rating: ★★★★☆☆
Overview: Transferator AB (publ) is a public private equity and venture capital firm with a market cap of approximately SEK145.24 million.
Operations: Transferator AB (publ) has not reported any revenue segments.
Market Cap: SEK145.24M
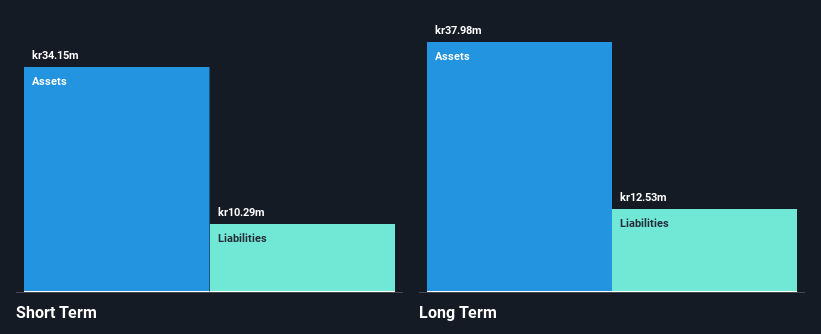
Transferator AB (publ) has shown some improvement in its financial performance, reporting a net income of SEK 0.469 million for Q2 2025 compared to a net loss the previous year, despite being historically unprofitable. The company's sales grew slightly to SEK 15.45 million for the quarter. However, it remains challenged by high volatility and insufficient interest coverage from EBIT. While its short-term assets exceed both short and long-term liabilities, providing some financial stability, the dividend yield is unsustainable given current earnings levels. The board's seasoned experience may help navigate these challenges as they work towards profitability.
- Navigate through the intricacies of Transferator with our comprehensive balance sheet health report here.
- Examine Transferator's past performance report to understand how it has performed in prior years.
Rank Progress (WSE:RNK)
Simply Wall St Financial Health Rating: ★★★★☆☆
Overview: Rank Progress S.A. is involved in investing in, developing, renting, and selling commercial real estate properties both in Poland and internationally, with a market cap of PLN177.24 million.
Operations: The company's revenue is primarily derived from leasing property (PLN41.95 million), selling real estate (PLN16.33 million), and providing construction services (PLN7.35 million).
Market Cap: PLN177.24M
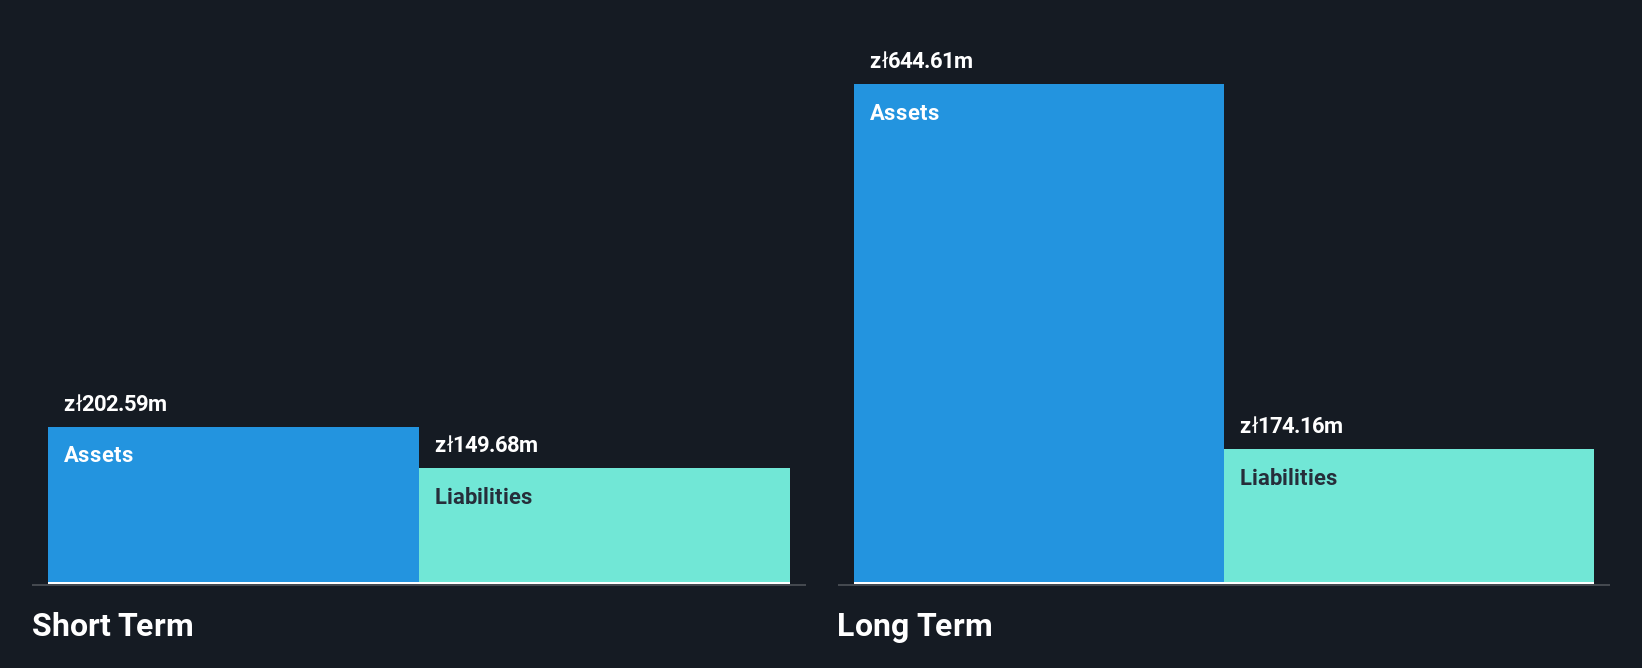
Rank Progress S.A. faces challenges due to its unprofitability, with a negative Return on Equity (-3.8%) and insufficient EBIT coverage of interest payments (1.4x). Despite this, the company has made strides in reducing its debt-to-equity ratio from 83.8% to 43% over five years and maintains a satisfactory net debt-to-equity ratio of 39.3%. Its short-term assets (PLN202.6 million) exceed both short-term (PLN149.7 million) and long-term liabilities (PLN174.2 million), offering some financial stability amid high share price volatility, which remains higher than most Polish stocks but stable over the past year at a weekly volatility of 6%.
- Unlock comprehensive insights into our analysis of Rank Progress stock in this financial health report.
- Understand Rank Progress' track record by examining our performance history report.
Taking Advantage
- Get an in-depth perspective on all 327 European Penny Stocks by using our screener here.
- Contemplating Other Strategies? Explore 23 top quantum computing companies leading the revolution in next-gen technology and shaping the future with breakthroughs in quantum algorithms, superconducting qubits, and cutting-edge research.
This article by Simply Wall St is general in nature. We provide commentary based on historical data and analyst forecasts only using an unbiased methodology and our articles are not intended to be financial advice. It does not constitute a recommendation to buy or sell any stock, and does not take account of your objectives, or your financial situation. We aim to bring you long-term focused analysis driven by fundamental data. Note that our analysis may not factor in the latest price-sensitive company announcements or qualitative material. Simply Wall St has no position in any stocks mentioned.
Mobile Infrastructure for Defense and Disaster
The next wave in robotics isn't humanoid. Its fully autonomous towers delivering 5G, ISR, and radar in under 30 minutes, anywhere.
Get the investor briefing before the next round of contracts
Sponsored On Behalf of CiTechNew: AI Stock Screener & Alerts
Our new AI Stock Screener scans the market every day to uncover opportunities.
• Dividend Powerhouses (3%+ Yield)
• Undervalued Small Caps with Insider Buying
• High growth Tech and AI Companies
Or build your own from over 50 metrics.
Have feedback on this article? Concerned about the content? Get in touch with us directly. Alternatively, email editorial-team@simplywallst.com
About WSE:RNK
Rank Progress
Invests in, develops, rents, and sells commercial real estate properties in Poland and internationally.
Adequate balance sheet with low risk.
Market Insights

Weekly Picks

THE KINGDOM OF BROWN GOODS: WHY MGPI IS BEING CRUSHED BY INVENTORY & PRIMED FOR RESURRECTION


Why Vertical Aerospace (NYSE: EVTL) is Worth Possibly Over 13x its Current Price


The Quiet Giant That Became AI’s Power Grid
Recently Updated Narratives


MINISO's fair value is projected at 26.69 with an anticipated PE ratio shift of 20x

Fiverr International will transform the freelance industry with AI-powered growth

Stride Stock: Online Education Finds Its Second Act
Popular Narratives


MicroVision will explode future revenue by 380.37% with a vision towards success


Crazy Undervalued 42 Baggers Silver Play (Active & Running Mine)


