- Sweden
- /
- Commercial Services
- /
- OM:INTRUM
Further weakness as Intrum (STO:INTRUM) drops 12% this week, taking three-year losses to 88%


It is doubtless a positive to see that the Intrum AB (publ) (STO:INTRUM) share price has gained some 45% in the last three months. But only the myopic could ignore the astounding decline over three years. To wit, the share price sky-dived 90% in that time. Arguably, the recent bounce is to be expected after such a bad drop. Only time will tell if the company can sustain the turnaround. We really hope anyone holding through that price crash has a diversified portfolio. Even when you lose money, you don't have to lose the lesson.
After losing 12% this past week, it's worth investigating the company's fundamentals to see what we can infer from past performance.
See our latest analysis for Intrum
In his essay The Superinvestors of Graham-and-Doddsville Warren Buffett described how share prices do not always rationally reflect the value of a business. One flawed but reasonable way to assess how sentiment around a company has changed is to compare the earnings per share (EPS) with the share price.
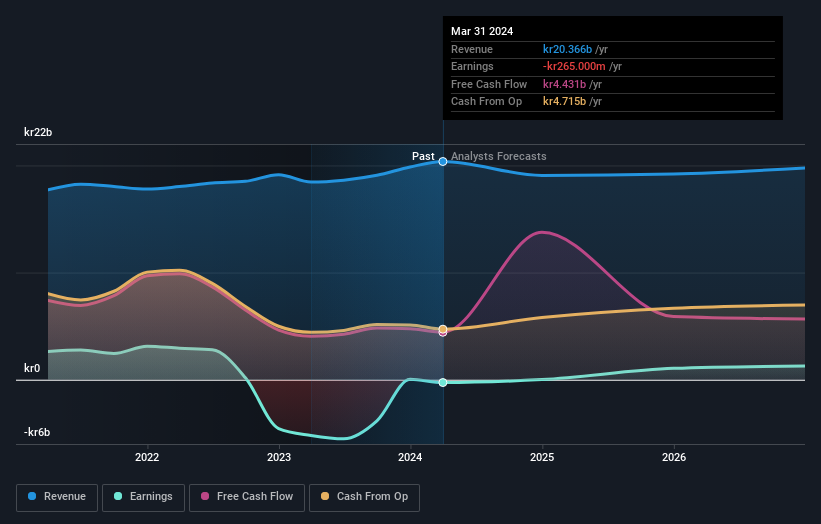
Intrum has made a profit in the past. On the other hand, it reported a trailing twelve months loss, suggesting it isn't reliably profitable. Other metrics may better explain the share price move.
We note that, in three years, revenue has actually grown at a 3.8% annual rate, so that doesn't seem to be a reason to sell shares. It's probably worth investigating Intrum further; while we may be missing something on this analysis, there might also be an opportunity.
The company's revenue and earnings (over time) are depicted in the image below (click to see the exact numbers).
It's probably worth noting we've seen significant insider buying in the last quarter, which we consider a positive. That said, we think earnings and revenue growth trends are even more important factors to consider. So it makes a lot of sense to check out what analysts think Intrum will earn in the future (free profit forecasts).
What About The Total Shareholder Return (TSR)?
Investors should note that there's a difference between Intrum's total shareholder return (TSR) and its share price change, which we've covered above. The TSR is a return calculation that accounts for the value of cash dividends (assuming that any dividend received was reinvested) and the calculated value of any discounted capital raisings and spin-offs. Its history of dividend payouts mean that Intrum's TSR, which was a 88% drop over the last 3 years, was not as bad as the share price return.
A Different Perspective
Investors in Intrum had a tough year, with a total loss of 58%, against a market gain of about 17%. Even the share prices of good stocks drop sometimes, but we want to see improvements in the fundamental metrics of a business, before getting too interested. Regrettably, last year's performance caps off a bad run, with the shareholders facing a total loss of 13% per year over five years. Generally speaking long term share price weakness can be a bad sign, though contrarian investors might want to research the stock in hope of a turnaround. While it is well worth considering the different impacts that market conditions can have on the share price, there are other factors that are even more important. For instance, we've identified 2 warning signs for Intrum that you should be aware of.
Intrum is not the only stock insiders are buying. So take a peek at this free list of small cap companies at attractive valuations which insiders have been buying.
Please note, the market returns quoted in this article reflect the market weighted average returns of stocks that currently trade on Swedish exchanges.
New: AI Stock Screener & Alerts
Our new AI Stock Screener scans the market every day to uncover opportunities.
• Dividend Powerhouses (3%+ Yield)
• Undervalued Small Caps with Insider Buying
• High growth Tech and AI Companies
Or build your own from over 50 metrics.
Have feedback on this article? Concerned about the content? Get in touch with us directly. Alternatively, email editorial-team (at) simplywallst.com.
This article by Simply Wall St is general in nature. We provide commentary based on historical data and analyst forecasts only using an unbiased methodology and our articles are not intended to be financial advice. It does not constitute a recommendation to buy or sell any stock, and does not take account of your objectives, or your financial situation. We aim to bring you long-term focused analysis driven by fundamental data. Note that our analysis may not factor in the latest price-sensitive company announcements or qualitative material. Simply Wall St has no position in any stocks mentioned.
Have feedback on this article? Concerned about the content? Get in touch with us directly. Alternatively, email editorial-team@simplywallst.com
About OM:INTRUM
Intrum
Provides credit management services in Europe and internationally.
Undervalued with moderate growth potential.
Similar Companies
Market Insights

Community Narratives

