
Advertisement
- Sweden
- /
- Construction
- /
- OM:OX2
We Think You Should Be Aware Of Some Concerning Factors In OX2's (STO:OX2) Earnings

The recent earnings posted by OX2 AB (publ) (STO:OX2) were solid, but the stock didn't move as much as we expected. However the statutory profit number doesn't tell the whole story, and we have found some factors which might be of concern to shareholders.
Check out our latest analysis for OX2
A Closer Look At OX2's Earnings
Many investors haven't heard of the accrual ratio from cashflow, but it is actually a useful measure of how well a company's profit is backed up by free cash flow (FCF) during a given period. In plain english, this ratio subtracts FCF from net profit, and divides that number by the company's average operating assets over that period. The ratio shows us how much a company's profit exceeds its FCF.
Therefore, it's actually considered a good thing when a company has a negative accrual ratio, but a bad thing if its accrual ratio is positive. While it's not a problem to have a positive accrual ratio, indicating a certain level of non-cash profits, a high accrual ratio is arguably a bad thing, because it indicates paper profits are not matched by cash flow. Notably, there is some academic evidence that suggests that a high accrual ratio is a bad sign for near-term profits, generally speaking.
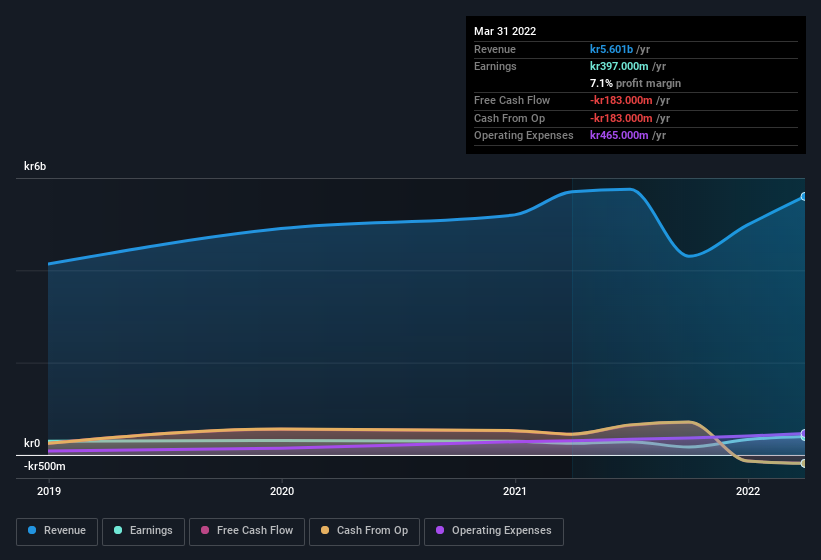
Over the twelve months to March 2022, OX2 recorded an accrual ratio of 2.75. As a general rule, that bodes poorly for future profitability. And indeed, during the period the company didn't produce any free cash flow whatsoever. In the last twelve months it actually had negative free cash flow, with an outflow of kr183m despite its profit of kr397.0m, mentioned above. We saw that FCF was kr445m a year ago though, so OX2 has at least been able to generate positive FCF in the past. The good news for shareholders is that OX2's accrual ratio was much better last year, so this year's poor reading might simply be a case of a short term mismatch between profit and FCF. Shareholders should look for improved cashflow relative to profit in the current year, if that is indeed the case.
That might leave you wondering what analysts are forecasting in terms of future profitability. Luckily, you can click here to see an interactive graph depicting future profitability, based on their estimates.
Our Take On OX2's Profit Performance
As we have made quite clear, we're a bit worried that OX2 didn't back up the last year's profit with free cashflow. As a result, we think it may well be the case that OX2's underlying earnings power is lower than its statutory profit. But at least holders can take some solace from the 23% per annum growth in EPS for the last three. Of course, we've only just scratched the surface when it comes to analysing its earnings; one could also consider margins, forecast growth, and return on investment, among other factors. If you'd like to know more about OX2 as a business, it's important to be aware of any risks it's facing. Case in point: We've spotted 2 warning signs for OX2 you should be mindful of and 1 of these shouldn't be ignored.
Today we've zoomed in on a single data point to better understand the nature of OX2's profit. But there are plenty of other ways to inform your opinion of a company. For example, many people consider a high return on equity as an indication of favorable business economics, while others like to 'follow the money' and search out stocks that insiders are buying. So you may wish to see this free collection of companies boasting high return on equity, or this list of stocks that insiders are buying.
New: AI Stock Screener & Alerts
Our new AI Stock Screener scans the market every day to uncover opportunities.
• Dividend Powerhouses (3%+ Yield)
• Undervalued Small Caps with Insider Buying
• High growth Tech and AI Companies
Or build your own from over 50 metrics.
Have feedback on this article? Concerned about the content? Get in touch with us directly. Alternatively, email editorial-team (at) simplywallst.com.
This article by Simply Wall St is general in nature. We provide commentary based on historical data and analyst forecasts only using an unbiased methodology and our articles are not intended to be financial advice. It does not constitute a recommendation to buy or sell any stock, and does not take account of your objectives, or your financial situation. We aim to bring you long-term focused analysis driven by fundamental data. Note that our analysis may not factor in the latest price-sensitive company announcements or qualitative material. Simply Wall St has no position in any stocks mentioned.
About OM:OX2
Flawless balance sheet and slightly overvalued.
Similar Companies
Market Insights

Advertisement
Community Narratives
Scaling up in building materials with smart M&A and growing profitability
Fair Value US$2.77|31.0% undervalued
CM
Community Contributor
Hims: The Platform Powering Personalised Healthcare
Fair Value US$114.01|53.1% undervalued
BL
Community Contributor
Undervalued lottery company with strong fundamentals
Fair Value AU$15.00|34.5% undervalued
RO
Community Contributor
Proximus, transferring money from the impatient to the patient investor
Fair Value €16.62|54.5% undervalued
AX
Community Contributor