Does Lyckegård Group (STO:LYGRD) Have A Healthy Balance Sheet?


Warren Buffett famously said, 'Volatility is far from synonymous with risk.' So it might be obvious that you need to consider debt, when you think about how risky any given stock is, because too much debt can sink a company. Importantly, Lyckegård Group AB (publ) (STO:LYGRD) does carry debt. But should shareholders be worried about its use of debt?
What Risk Does Debt Bring?
Debt is a tool to help businesses grow, but if a business is incapable of paying off its lenders, then it exists at their mercy. Ultimately, if the company can't fulfill its legal obligations to repay debt, shareholders could walk away with nothing. While that is not too common, we often do see indebted companies permanently diluting shareholders because lenders force them to raise capital at a distressed price. Of course, plenty of companies use debt to fund growth, without any negative consequences. When we think about a company's use of debt, we first look at cash and debt together.
See our latest analysis for Lyckegård Group
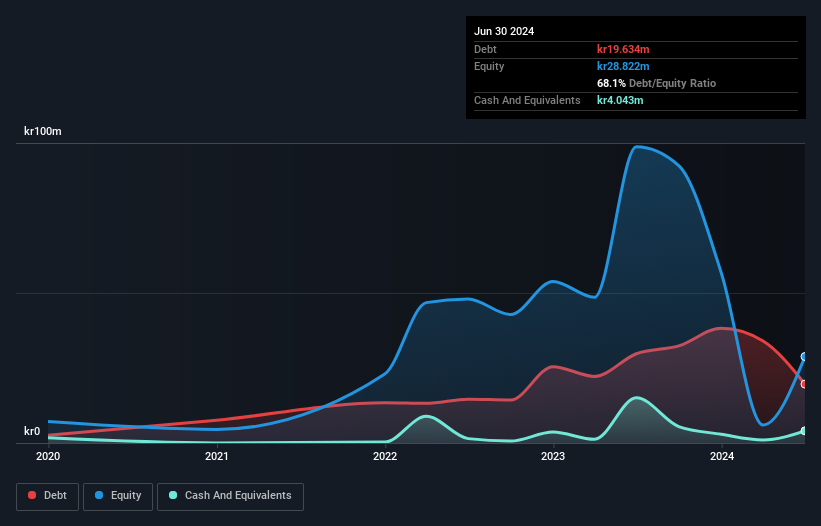
How Much Debt Does Lyckegård Group Carry?
As you can see below, Lyckegård Group had kr19.6m of debt at June 2024, down from kr29.8m a year prior. However, because it has a cash reserve of kr4.04m, its net debt is less, at about kr15.6m.
How Strong Is Lyckegård Group's Balance Sheet?
Zooming in on the latest balance sheet data, we can see that Lyckegård Group had liabilities of kr81.6m due within 12 months and liabilities of kr26.9m due beyond that. On the other hand, it had cash of kr4.04m and kr43.2m worth of receivables due within a year. So it has liabilities totalling kr61.3m more than its cash and near-term receivables, combined.
This is a mountain of leverage relative to its market capitalization of kr69.1m. Should its lenders demand that it shore up the balance sheet, shareholders would likely face severe dilution. There's no doubt that we learn most about debt from the balance sheet. But it is Lyckegård Group's earnings that will influence how the balance sheet holds up in the future. So if you're keen to discover more about its earnings, it might be worth checking out this graph of its long term earnings trend.
In the last year Lyckegård Group wasn't profitable at an EBIT level, but managed to grow its revenue by 70%, to kr198m. Shareholders probably have their fingers crossed that it can grow its way to profits.
Caveat Emptor
Despite the top line growth, Lyckegård Group still had an earnings before interest and tax (EBIT) loss over the last year. Its EBIT loss was a whopping kr46m. Considering that alongside the liabilities mentioned above does not give us much confidence that company should be using so much debt. So we think its balance sheet is a little strained, though not beyond repair. Another cause for caution is that is bled kr15m in negative free cash flow over the last twelve months. So in short it's a really risky stock. There's no doubt that we learn most about debt from the balance sheet. However, not all investment risk resides within the balance sheet - far from it. We've identified 4 warning signs with Lyckegård Group (at least 3 which don't sit too well with us) , and understanding them should be part of your investment process.
At the end of the day, it's often better to focus on companies that are free from net debt. You can access our special list of such companies (all with a track record of profit growth). It's free.
If you're looking to trade Lyckegård Group, open an account with the lowest-cost platform trusted by professionals, Interactive Brokers.
With clients in over 200 countries and territories, and access to 160 markets, IBKR lets you trade stocks, options, futures, forex, bonds and funds from a single integrated account.
Enjoy no hidden fees, no account minimums, and FX conversion rates as low as 0.03%, far better than what most brokers offer.
Sponsored ContentNew: AI Stock Screener & Alerts
Our new AI Stock Screener scans the market every day to uncover opportunities.
• Dividend Powerhouses (3%+ Yield)
• Undervalued Small Caps with Insider Buying
• High growth Tech and AI Companies
Or build your own from over 50 metrics.
Have feedback on this article? Concerned about the content? Get in touch with us directly. Alternatively, email editorial-team (at) simplywallst.com.
This article by Simply Wall St is general in nature. We provide commentary based on historical data and analyst forecasts only using an unbiased methodology and our articles are not intended to be financial advice. It does not constitute a recommendation to buy or sell any stock, and does not take account of your objectives, or your financial situation. We aim to bring you long-term focused analysis driven by fundamental data. Note that our analysis may not factor in the latest price-sensitive company announcements or qualitative material. Simply Wall St has no position in any stocks mentioned.
About OM:LYGRD
Lyckegård Group
Develops, markets, and sells mechanical tools for sustainable agriculture market in Sweden, Norway, and Finland.
Moderate and slightly overvalued.
Market Insights

Community Narratives
