
Advertisement
To find a multi-bagger stock, what are the underlying trends we should look for in a business? One common approach is to try and find a company with returns on capital employed (ROCE) that are increasing, in conjunction with a growing amount of capital employed. If you see this, it typically means it's a company with a great business model and plenty of profitable reinvestment opportunities. With that in mind, we've noticed some promising trends at SoftBlue (WSE:SBE) so let's look a bit deeper.
What is Return On Capital Employed (ROCE)?
Just to clarify if you're unsure, ROCE is a metric for evaluating how much pre-tax income (in percentage terms) a company earns on the capital invested in its business. To calculate this metric for SoftBlue, this is the formula:
Return on Capital Employed = Earnings Before Interest and Tax (EBIT) ÷ (Total Assets - Current Liabilities)
0.021 = zł1.2m ÷ (zł66m - zł9.1m) (Based on the trailing twelve months to June 2021).
So, SoftBlue has an ROCE of 2.1%. Ultimately, that's a low return and it under-performs the IT industry average of 15%.
See our latest analysis for SoftBlue
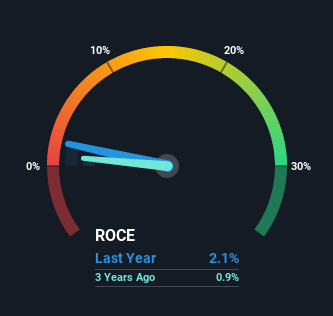
Historical performance is a great place to start when researching a stock so above you can see the gauge for SoftBlue's ROCE against it's prior returns. If you want to delve into the historical earnings, revenue and cash flow of SoftBlue, check out these free graphs here.
So How Is SoftBlue's ROCE Trending?
The fact that SoftBlue is now generating some pre-tax profits from its prior investments is very encouraging. The company was generating losses five years ago, but now it's earning 2.1% which is a sight for sore eyes. Not only that, but the company is utilizing 419% more capital than before, but that's to be expected from a company trying to break into profitability. This can indicate that there's plenty of opportunities to invest capital internally and at ever higher rates, both common traits of a multi-bagger.
On a related note, the company's ratio of current liabilities to total assets has decreased to 14%, which basically reduces it's funding from the likes of short-term creditors or suppliers. This tells us that SoftBlue has grown its returns without a reliance on increasing their current liabilities, which we're very happy with.
Our Take On SoftBlue's ROCE
Long story short, we're delighted to see that SoftBlue's reinvestment activities have paid off and the company is now profitable. Investors may not be impressed by the favorable underlying trends yet because over the last five years the stock has only returned 7.3% to shareholders. So with that in mind, we think the stock deserves further research.
Since virtually every company faces some risks, it's worth knowing what they are, and we've spotted 4 warning signs for SoftBlue (of which 1 is a bit unpleasant!) that you should know about.
While SoftBlue isn't earning the highest return, check out this free list of companies that are earning high returns on equity with solid balance sheets.
If you decide to trade SoftBlue, use the lowest-cost* platform that is rated #1 Overall by Barron’s, Interactive Brokers. Trade stocks, options, futures, forex, bonds and funds on 135 markets, all from a single integrated account. Promoted
New: Manage All Your Stock Portfolios in One Place
We've created the ultimate portfolio companion for stock investors, and it's free.
• Connect an unlimited number of Portfolios and see your total in one currency
• Be alerted to new Warning Signs or Risks via email or mobile
• Track the Fair Value of your stocks
This article by Simply Wall St is general in nature. We provide commentary based on historical data and analyst forecasts only using an unbiased methodology and our articles are not intended to be financial advice. It does not constitute a recommendation to buy or sell any stock, and does not take account of your objectives, or your financial situation. We aim to bring you long-term focused analysis driven by fundamental data. Note that our analysis may not factor in the latest price-sensitive company announcements or qualitative material. Simply Wall St has no position in any stocks mentioned.
*Interactive Brokers Rated Lowest Cost Broker by StockBrokers.com Annual Online Review 2020
Have feedback on this article? Concerned about the content? Get in touch with us directly. Alternatively, email editorial-team (at) simplywallst.com.
About WSE:SBE
Flawless balance sheet with very low risk.
Market Insights

Advertisement
Weekly Picks
WO

woodworthfund on MGP Ingredients ·
THE KINGDOM OF BROWN GOODS: WHY MGPI IS BEING CRUSHED BY INVENTORY & PRIMED FOR RESURRECTION
Fair Value:US$4034.1% undervalued
20 followersusers have followed this narrative
1 commentusers have commented on this narrative
5 likesusers have liked this narrative
DO


Double_Bubbler on Vertical Aerospace ·
Why Vertical Aerospace (NYSE: EVTL) is Worth Possibly Over 13x its Current Price
Fair Value:US$6089.9% undervalued
22 followersusers have followed this narrative
2 commentsusers have commented on this narrative
17 likesusers have liked this narrative
TI


TickerTickle on Oracle ·
The Quiet Giant That Became AI’s Power Grid
Fair Value:US$389.8149.0% undervalued
43 followersusers have followed this narrative
3 commentsusers have commented on this narrative
8 likesusers have liked this narrative
Recently Updated Narratives
KI

KiwiInvest on Rocket Lab ·
Rocket Lab USA Will Ignite a 30% Revenue Growth Journey
Fair Value:US$97.8335.1% undervalued
136 followersusers have followed this narrative
8 commentsusers have commented on this narrative
0 likesusers have liked this narrative
BA


Bauyrzhan on Dollar General ·
Dollar general to grow
Fair Value:US$158.916.5% undervalued
1 followerusers have followed this narrative
0 commentsusers have commented on this narrative
0 likesusers have liked this narrative
MH


mhbb on Mastersystem Infotama ·
Mastersystem Infotama will achieve 18.9% revenue growth as fair value hits IDR1,650
Fair Value:Rp1.63k13.8% undervalued
2 followersusers have followed this narrative
0 commentsusers have commented on this narrative
0 likesusers have liked this narrative
Popular Narratives
TH


TheWallstreetKing on MicroVision ·
MicroVision will explode future revenue by 380.37% with a vision towards success
Fair Value:US$6098.4% undervalued
119 followersusers have followed this narrative
11 commentsusers have commented on this narrative
22 likesusers have liked this narrative
AN


AnalystConsensusTarget on NVIDIA ·
NVDA: Expanding AI Demand Will Drive Major Data Center Investments Through 2026
Fair Value:US$250.3927.7% undervalued
963 followersusers have followed this narrative
6 commentsusers have commented on this narrative
25 likesusers have liked this narrative
RO


RockeTeller on Santacruz Silver Mining ·
Crazy Undervalued 42 Baggers Silver Play (Active & Running Mine)
Fair Value:CA$8688.0% undervalued
77 followersusers have followed this narrative
8 commentsusers have commented on this narrative
21 likesusers have liked this narrative

