
Advertisement
- Poland
- /
- Commercial Services
- /
- WSE:BMC
The 13% return this week takes Bumech's (WSE:BMC) shareholders three-year gains to 419%

It hasn't been the best quarter for Bumech S.A. (WSE:BMC) shareholders, since the share price has fallen 15% in that time. But that doesn't displace its brilliant performance over three years. The longer term view reveals that the share price is up 376% in that period. So the recent fall doesn't do much to dampen our respect for the business. Only time will tell if there is still too much optimism currently reflected in the share price.
Since it's been a strong week for Bumech shareholders, let's have a look at trend of the longer term fundamentals.
Check out our latest analysis for Bumech
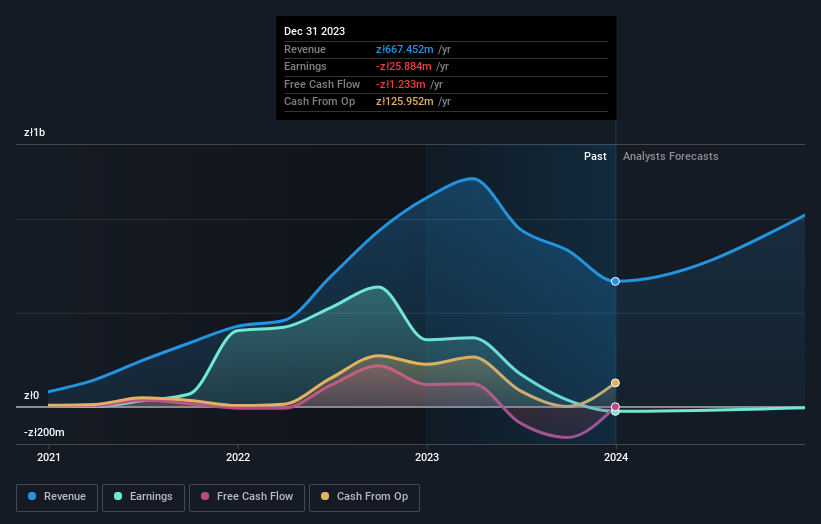
Bumech isn't currently profitable, so most analysts would look to revenue growth to get an idea of how fast the underlying business is growing. Generally speaking, companies without profits are expected to grow revenue every year, and at a good clip. Some companies are willing to postpone profitability to grow revenue faster, but in that case one would hope for good top-line growth to make up for the lack of earnings.
Over the last three years Bumech has grown its revenue at 50% annually. That's much better than most loss-making companies. In light of this attractive revenue growth, it seems somewhat appropriate that the share price has been rocketing, boasting a gain of 68% per year, over the same period. Despite the strong run, top performers like Bumech have been known to go on winning for decades. So we'd recommend you take a closer look at this one, or even put it on your watchlist.
The graphic below depicts how earnings and revenue have changed over time (unveil the exact values by clicking on the image).
If you are thinking of buying or selling Bumech stock, you should check out this FREE detailed report on its balance sheet.
What About Dividends?
When looking at investment returns, it is important to consider the difference between total shareholder return (TSR) and share price return. The TSR is a return calculation that accounts for the value of cash dividends (assuming that any dividend received was reinvested) and the calculated value of any discounted capital raisings and spin-offs. So for companies that pay a generous dividend, the TSR is often a lot higher than the share price return. In the case of Bumech, it has a TSR of 419% for the last 3 years. That exceeds its share price return that we previously mentioned. This is largely a result of its dividend payments!
A Different Perspective
While the broader market gained around 31% in the last year, Bumech shareholders lost 59% (even including dividends). However, keep in mind that even the best stocks will sometimes underperform the market over a twelve month period. Longer term investors wouldn't be so upset, since they would have made 35%, each year, over five years. If the fundamental data continues to indicate long term sustainable growth, the current sell-off could be an opportunity worth considering. It's always interesting to track share price performance over the longer term. But to understand Bumech better, we need to consider many other factors. For example, we've discovered 3 warning signs for Bumech that you should be aware of before investing here.
If you like to buy stocks alongside management, then you might just love this free list of companies. (Hint: many of them are unnoticed AND have attractive valuation).
Please note, the market returns quoted in this article reflect the market weighted average returns of stocks that currently trade on Polish exchanges.
Valuation is complex, but we're here to simplify it.
Discover if Bumech might be undervalued or overvalued with our detailed analysis, featuring fair value estimates, potential risks, dividends, insider trades, and its financial condition.
Access Free AnalysisHave feedback on this article? Concerned about the content? Get in touch with us directly. Alternatively, email editorial-team (at) simplywallst.com.
This article by Simply Wall St is general in nature. We provide commentary based on historical data and analyst forecasts only using an unbiased methodology and our articles are not intended to be financial advice. It does not constitute a recommendation to buy or sell any stock, and does not take account of your objectives, or your financial situation. We aim to bring you long-term focused analysis driven by fundamental data. Note that our analysis may not factor in the latest price-sensitive company announcements or qualitative material. Simply Wall St has no position in any stocks mentioned.
About WSE:BMC
Bumech
Provides services in the area of drilling underground workings for the mining industry.
Good value with adequate balance sheet.
Market Insights

Advertisement
Community Narratives
RIO is poised to weather a depressed iron ore environment, but commodity diversification comes with lower margins
Fair Value AU$110.51|4.0% overvalued
DU
Community Contributor
The demand for personalized medicine will keep Thermo Fisher Scientific thriving
Fair Value US$540.27|20.1% undervalued
UN
Community Contributor
Silver Play by A Family with 10x Potential
Fair Value UK£24.00|88.5% undervalued
RO
Community Contributor