
Advertisement
- South Korea
- /
- Electronic Equipment and Components
- /
- KOSE:A007660
Are Investors Undervaluing ISU Petasys Co., Ltd. (KRX:007660) By 47%?

Key Insights
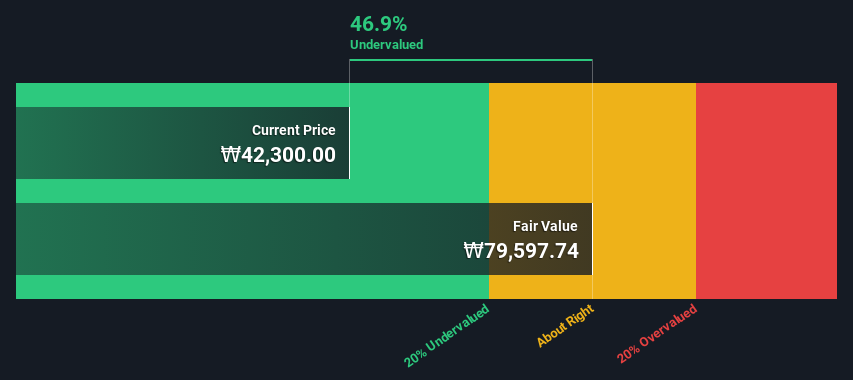
- ISU Petasys' estimated fair value is ₩79,598 based on 2 Stage Free Cash Flow to Equity
- ISU Petasys' ₩42,300 share price signals that it might be 47% undervalued
- Analyst price target for A007660 is ₩44,250 which is 44% below our fair value estimate
How far off is ISU Petasys Co., Ltd. (KRX:007660) from its intrinsic value? Using the most recent financial data, we'll take a look at whether the stock is fairly priced by taking the forecast future cash flows of the company and discounting them back to today's value. One way to achieve this is by employing the Discounted Cash Flow (DCF) model. It may sound complicated, but actually it is quite simple!
We generally believe that a company's value is the present value of all of the cash it will generate in the future. However, a DCF is just one valuation metric among many, and it is not without flaws. For those who are keen learners of equity analysis, the Simply Wall St analysis model here may be something of interest to you.
See our latest analysis for ISU Petasys
Is ISU Petasys Fairly Valued?
We use what is known as a 2-stage model, which simply means we have two different periods of growth rates for the company's cash flows. Generally the first stage is higher growth, and the second stage is a lower growth phase. To begin with, we have to get estimates of the next ten years of cash flows. Where possible we use analyst estimates, but when these aren't available we extrapolate the previous free cash flow (FCF) from the last estimate or reported value. We assume companies with shrinking free cash flow will slow their rate of shrinkage, and that companies with growing free cash flow will see their growth rate slow, over this period. We do this to reflect that growth tends to slow more in the early years than it does in later years.
A DCF is all about the idea that a dollar in the future is less valuable than a dollar today, and so the sum of these future cash flows is then discounted to today's value:
10-year free cash flow (FCF) forecast
| 2024 | 2025 | 2026 | 2027 | 2028 | 2029 | 2030 | 2031 | 2032 | 2033 | |
| Levered FCF (₩, Millions) | ₩30.7b | ₩83.7b | ₩134.3b | ₩192.0b | ₩251.3b | ₩307.4b | ₩357.7b | ₩401.2b | ₩438.3b | ₩469.8b |
| Growth Rate Estimate Source | Analyst x3 | Analyst x3 | Est @ 60.46% | Est @ 43.05% | Est @ 30.86% | Est @ 22.32% | Est @ 16.35% | Est @ 12.17% | Est @ 9.24% | Est @ 7.19% |
| Present Value (₩, Millions) Discounted @ 8.5% | ₩28.3k | ₩71.1k | ₩105.1k | ₩138.6k | ₩167.2k | ₩188.6k | ₩202.2k | ₩209.1k | ₩210.5k | ₩208.0k |
("Est" = FCF growth rate estimated by Simply Wall St)
Present Value of 10-year Cash Flow (PVCF) = ₩1.5t
We now need to calculate the Terminal Value, which accounts for all the future cash flows after this ten year period. The Gordon Growth formula is used to calculate Terminal Value at a future annual growth rate equal to the 5-year average of the 10-year government bond yield of 2.4%. We discount the terminal cash flows to today's value at a cost of equity of 8.5%.
Terminal Value (TV)= FCF2033 × (1 + g) ÷ (r – g) = ₩470b× (1 + 2.4%) ÷ (8.5%– 2.4%) = ₩7.9t
Present Value of Terminal Value (PVTV)= TV / (1 + r)10= ₩7.9t÷ ( 1 + 8.5%)10= ₩3.5t
The total value is the sum of cash flows for the next ten years plus the discounted terminal value, which results in the Total Equity Value, which in this case is ₩5.0t. In the final step we divide the equity value by the number of shares outstanding. Compared to the current share price of ₩42k, the company appears quite good value at a 47% discount to where the stock price trades currently. The assumptions in any calculation have a big impact on the valuation, so it is better to view this as a rough estimate, not precise down to the last cent.
The Assumptions
The calculation above is very dependent on two assumptions. The first is the discount rate and the other is the cash flows. If you don't agree with these result, have a go at the calculation yourself and play with the assumptions. The DCF also does not consider the possible cyclicality of an industry, or a company's future capital requirements, so it does not give a full picture of a company's potential performance. Given that we are looking at ISU Petasys as potential shareholders, the cost of equity is used as the discount rate, rather than the cost of capital (or weighted average cost of capital, WACC) which accounts for debt. In this calculation we've used 8.5%, which is based on a levered beta of 1.142. Beta is a measure of a stock's volatility, compared to the market as a whole. We get our beta from the industry average beta of globally comparable companies, with an imposed limit between 0.8 and 2.0, which is a reasonable range for a stable business.
SWOT Analysis for ISU Petasys
Strength
- Debt is well covered by earnings and cashflows.
Weakness
- Earnings declined over the past year.
- Dividend is low compared to the top 25% of dividend payers in the Electronic market.
Opportunity
- Annual earnings are forecast to grow faster than the South Korean market.
- Trading below our estimate of fair value by more than 20%.
Threat
- Revenue is forecast to grow slower than 20% per year.
Moving On:
Although the valuation of a company is important, it ideally won't be the sole piece of analysis you scrutinize for a company. The DCF model is not a perfect stock valuation tool. Rather it should be seen as a guide to "what assumptions need to be true for this stock to be under/overvalued?" If a company grows at a different rate, or if its cost of equity or risk free rate changes sharply, the output can look very different. What is the reason for the share price sitting below the intrinsic value? For ISU Petasys, we've compiled three additional aspects you should further examine:
- Risks: We feel that you should assess the 3 warning signs for ISU Petasys (1 is concerning!) we've flagged before making an investment in the company.
- Future Earnings: How does A007660's growth rate compare to its peers and the wider market? Dig deeper into the analyst consensus number for the upcoming years by interacting with our free analyst growth expectation chart.
- Other Solid Businesses: Low debt, high returns on equity and good past performance are fundamental to a strong business. Why not explore our interactive list of stocks with solid business fundamentals to see if there are other companies you may not have considered!
PS. Simply Wall St updates its DCF calculation for every South Korean stock every day, so if you want to find the intrinsic value of any other stock just search here.
New: AI Stock Screener & Alerts
Our new AI Stock Screener scans the market every day to uncover opportunities.
• Dividend Powerhouses (3%+ Yield)
• Undervalued Small Caps with Insider Buying
• High growth Tech and AI Companies
Or build your own from over 50 metrics.
Have feedback on this article? Concerned about the content? Get in touch with us directly. Alternatively, email editorial-team (at) simplywallst.com.
This article by Simply Wall St is general in nature. We provide commentary based on historical data and analyst forecasts only using an unbiased methodology and our articles are not intended to be financial advice. It does not constitute a recommendation to buy or sell any stock, and does not take account of your objectives, or your financial situation. We aim to bring you long-term focused analysis driven by fundamental data. Note that our analysis may not factor in the latest price-sensitive company announcements or qualitative material. Simply Wall St has no position in any stocks mentioned.
About KOSE:A007660
ISU Petasys
Manufactures and sells printed circuit boards (PCBs) worldwide.
Outstanding track record with high growth potential.
Similar Companies
Market Insights

Advertisement
Community Narratives
RIO is poised to weather a depressed iron ore environment, but commodity diversification comes with lower margins
Fair Value AU$110.51|4.0% overvalued
DU
Community Contributor
The demand for personalized medicine will keep Thermo Fisher Scientific thriving
Fair Value US$540.27|21.5% undervalued
UN
Community Contributor
Silver Play by A Family with 10x Potential
Fair Value UK£24.00|88.8% undervalued
RO
Community Contributor