- South Korea
- /
- Healthtech
- /
- KOSDAQ:A263700
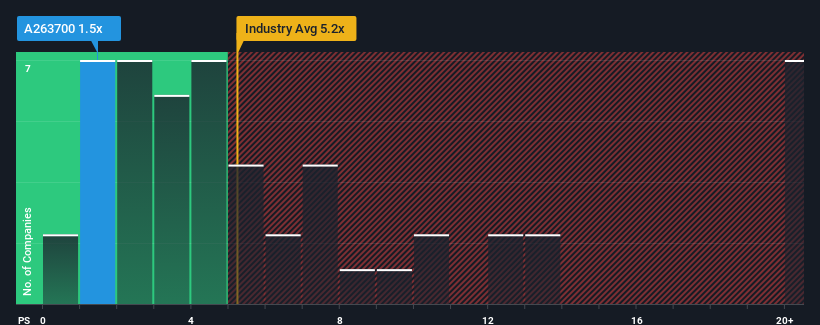
Carelabs Co.,Ltd (KOSDAQ:263700) Held Back By Insufficient Growth Even After Shares Climb 50%


Carelabs Co.,Ltd (KOSDAQ:263700) shareholders have had their patience rewarded with a 50% share price jump in the last month. Not all shareholders will be feeling jubilant, since the share price is still down a very disappointing 26% in the last twelve months.
Even after such a large jump in price, CarelabsLtd may still look like a strong buying opportunity at present with its price-to-sales (or "P/S") ratio of 1.5x, considering almost half of all companies in the Healthcare Services industry in Korea have P/S ratios greater than 24.3x and even P/S higher than 76x aren't out of the ordinary. However, the P/S might be quite low for a reason and it requires further investigation to determine if it's justified.
See our latest analysis for CarelabsLtd
What Does CarelabsLtd's Recent Performance Look Like?
For example, consider that CarelabsLtd's financial performance has been poor lately as its revenue has been in decline. It might be that many expect the disappointing revenue performance to continue or accelerate, which has repressed the P/S. Those who are bullish on CarelabsLtd will be hoping that this isn't the case so that they can pick up the stock at a lower valuation.
Want the full picture on earnings, revenue and cash flow for the company? Then our free report on CarelabsLtd will help you shine a light on its historical performance.How Is CarelabsLtd's Revenue Growth Trending?
The only time you'd be truly comfortable seeing a P/S as depressed as CarelabsLtd's is when the company's growth is on track to lag the industry decidedly.
In reviewing the last year of financials, we were disheartened to see the company's revenues fell to the tune of 9.6%. This has soured the latest three-year period, which nevertheless managed to deliver a decent 12% overall rise in revenue. Although it's been a bumpy ride, it's still fair to say the revenue growth recently has been mostly respectable for the company.
This is in contrast to the rest of the industry, which is expected to grow by 40% over the next year, materially higher than the company's recent medium-term annualised growth rates.
With this information, we can see why CarelabsLtd is trading at a P/S lower than the industry. Apparently many shareholders weren't comfortable holding on to something they believe will continue to trail the wider industry.
What Does CarelabsLtd's P/S Mean For Investors?
CarelabsLtd's recent share price jump still sees fails to bring its P/S alongside the industry median. We'd say the price-to-sales ratio's power isn't primarily as a valuation instrument but rather to gauge current investor sentiment and future expectations.
In line with expectations, CarelabsLtd maintains its low P/S on the weakness of its recent three-year growth being lower than the wider industry forecast. Right now shareholders are accepting the low P/S as they concede future revenue probably won't provide any pleasant surprises. If recent medium-term revenue trends continue, it's hard to see the share price experience a reversal of fortunes anytime soon.
We don't want to rain on the parade too much, but we did also find 4 warning signs for CarelabsLtd (2 shouldn't be ignored!) that you need to be mindful of.
If strong companies turning a profit tickle your fancy, then you'll want to check out this free list of interesting companies that trade on a low P/E (but have proven they can grow earnings).
If you're looking to trade CarelabsLtd, open an account with the lowest-cost platform trusted by professionals, Interactive Brokers.
With clients in over 200 countries and territories, and access to 160 markets, IBKR lets you trade stocks, options, futures, forex, bonds and funds from a single integrated account.
Enjoy no hidden fees, no account minimums, and FX conversion rates as low as 0.03%, far better than what most brokers offer.
Sponsored ContentNew: AI Stock Screener & Alerts
Our new AI Stock Screener scans the market every day to uncover opportunities.
• Dividend Powerhouses (3%+ Yield)
• Undervalued Small Caps with Insider Buying
• High growth Tech and AI Companies
Or build your own from over 50 metrics.
Have feedback on this article? Concerned about the content? Get in touch with us directly. Alternatively, email editorial-team (at) simplywallst.com.
This article by Simply Wall St is general in nature. We provide commentary based on historical data and analyst forecasts only using an unbiased methodology and our articles are not intended to be financial advice. It does not constitute a recommendation to buy or sell any stock, and does not take account of your objectives, or your financial situation. We aim to bring you long-term focused analysis driven by fundamental data. Note that our analysis may not factor in the latest price-sensitive company announcements or qualitative material. Simply Wall St has no position in any stocks mentioned.
About KOSDAQ:A263700
CarelabsLtd
Operates as a healthcare and beauty care platform company in South Korea.
Excellent balance sheet low.
Market Insights

Community Narratives
