- South Korea
- /
- Electrical
- /
- KOSDAQ:A119850
GnCenergy Co., Ltd (KOSDAQ:119850) Held Back By Insufficient Growth Even After Shares Climb 26%


GnCenergy Co., Ltd (KOSDAQ:119850) shares have continued their recent momentum with a 26% gain in the last month alone. The last month tops off a massive increase of 247% in the last year.
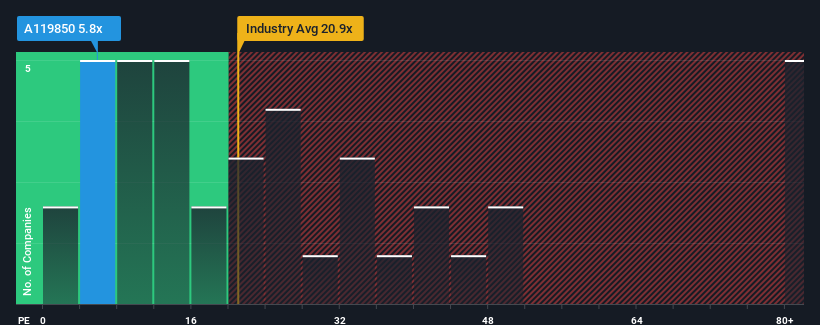
In spite of the firm bounce in price, GnCenergy's price-to-earnings (or "P/E") ratio of 5.8x might still make it look like a strong buy right now compared to the market in Korea, where around half of the companies have P/E ratios above 13x and even P/E's above 25x are quite common. However, the P/E might be quite low for a reason and it requires further investigation to determine if it's justified.
Recent times have been quite advantageous for GnCenergy as its earnings have been rising very briskly. One possibility is that the P/E is low because investors think this strong earnings growth might actually underperform the broader market in the near future. If that doesn't eventuate, then existing shareholders have reason to be quite optimistic about the future direction of the share price.
See our latest analysis for GnCenergy
How Is GnCenergy's Growth Trending?
GnCenergy's P/E ratio would be typical for a company that's expected to deliver very poor growth or even falling earnings, and importantly, perform much worse than the market.
Retrospectively, the last year delivered an exceptional 393% gain to the company's bottom line. Although, its longer-term performance hasn't been as strong with three-year EPS growth being relatively non-existent overall. So it appears to us that the company has had a mixed result in terms of growing earnings over that time.
This is in contrast to the rest of the market, which is expected to grow by 26% over the next year, materially higher than the company's recent medium-term annualised growth rates.
In light of this, it's understandable that GnCenergy's P/E sits below the majority of other companies. Apparently many shareholders weren't comfortable holding on to something they believe will continue to trail the bourse.
The Bottom Line On GnCenergy's P/E
Shares in GnCenergy are going to need a lot more upward momentum to get the company's P/E out of its slump. Generally, our preference is to limit the use of the price-to-earnings ratio to establishing what the market thinks about the overall health of a company.
As we suspected, our examination of GnCenergy revealed its three-year earnings trends are contributing to its low P/E, given they look worse than current market expectations. At this stage investors feel the potential for an improvement in earnings isn't great enough to justify a higher P/E ratio. Unless the recent medium-term conditions improve, they will continue to form a barrier for the share price around these levels.
It's always necessary to consider the ever-present spectre of investment risk. We've identified 2 warning signs with GnCenergy, and understanding these should be part of your investment process.
If these risks are making you reconsider your opinion on GnCenergy, explore our interactive list of high quality stocks to get an idea of what else is out there.
If you're looking to trade GnCenergy, open an account with the lowest-cost platform trusted by professionals, Interactive Brokers.
With clients in over 200 countries and territories, and access to 160 markets, IBKR lets you trade stocks, options, futures, forex, bonds and funds from a single integrated account.
Enjoy no hidden fees, no account minimums, and FX conversion rates as low as 0.03%, far better than what most brokers offer.
Sponsored ContentNew: Manage All Your Stock Portfolios in One Place
We've created the ultimate portfolio companion for stock investors, and it's free.
• Connect an unlimited number of Portfolios and see your total in one currency
• Be alerted to new Warning Signs or Risks via email or mobile
• Track the Fair Value of your stocks
Have feedback on this article? Concerned about the content? Get in touch with us directly. Alternatively, email editorial-team (at) simplywallst.com.
This article by Simply Wall St is general in nature. We provide commentary based on historical data and analyst forecasts only using an unbiased methodology and our articles are not intended to be financial advice. It does not constitute a recommendation to buy or sell any stock, and does not take account of your objectives, or your financial situation. We aim to bring you long-term focused analysis driven by fundamental data. Note that our analysis may not factor in the latest price-sensitive company announcements or qualitative material. Simply Wall St has no position in any stocks mentioned.
About KOSDAQ:A119850
GnCenergy
Engages in the manufacture and sale of power generators in Korea.
Outstanding track record with flawless balance sheet.
Market Insights

Community Narratives
