

Howard Marks put it nicely when he said that, rather than worrying about share price volatility, 'The possibility of permanent loss is the risk I worry about... and every practical investor I know worries about.' So it might be obvious that you need to consider debt, when you think about how risky any given stock is, because too much debt can sink a company. Importantly, ANA Holdings Inc. (TSE:9202) does carry debt. But is this debt a concern to shareholders?
Why Does Debt Bring Risk?
Generally speaking, debt only becomes a real problem when a company can't easily pay it off, either by raising capital or with its own cash flow. Ultimately, if the company can't fulfill its legal obligations to repay debt, shareholders could walk away with nothing. However, a more usual (but still expensive) situation is where a company must dilute shareholders at a cheap share price simply to get debt under control. Of course, the upside of debt is that it often represents cheap capital, especially when it replaces dilution in a company with the ability to reinvest at high rates of return. When we think about a company's use of debt, we first look at cash and debt together.
Check out our latest analysis for ANA Holdings
How Much Debt Does ANA Holdings Carry?
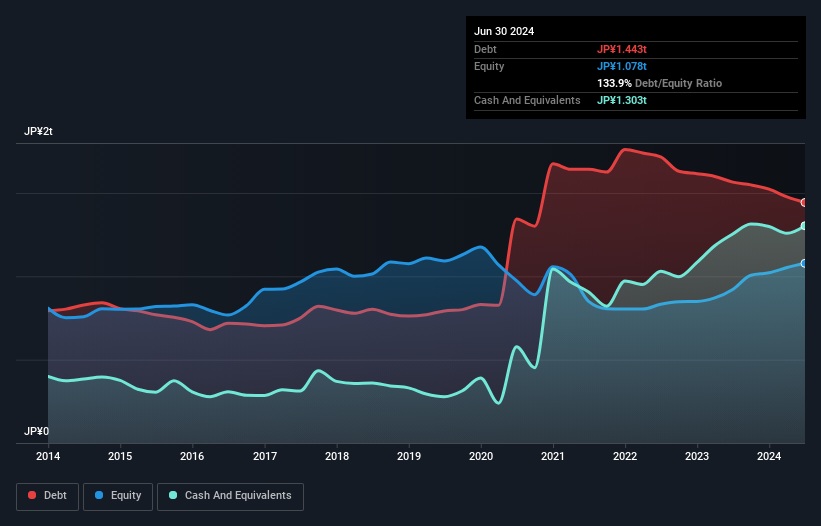
As you can see below, ANA Holdings had JP¥1.44t of debt at June 2024, down from JP¥1.57t a year prior. However, it does have JP¥1.30t in cash offsetting this, leading to net debt of about JP¥139.8b.
A Look At ANA Holdings' Liabilities
The latest balance sheet data shows that ANA Holdings had liabilities of JP¥1.09t due within a year, and liabilities of JP¥1.46t falling due after that. On the other hand, it had cash of JP¥1.30t and JP¥226.5b worth of receivables due within a year. So its liabilities total JP¥1.02t more than the combination of its cash and short-term receivables.
This deficit is considerable relative to its market capitalization of JP¥1.37t, so it does suggest shareholders should keep an eye on ANA Holdings' use of debt. This suggests shareholders would be heavily diluted if the company needed to shore up its balance sheet in a hurry.
We use two main ratios to inform us about debt levels relative to earnings. The first is net debt divided by earnings before interest, tax, depreciation, and amortization (EBITDA), while the second is how many times its earnings before interest and tax (EBIT) covers its interest expense (or its interest cover, for short). This way, we consider both the absolute quantum of the debt, as well as the interest rates paid on it.
With net debt sitting at just 0.41 times EBITDA, ANA Holdings is arguably pretty conservatively geared. And it boasts interest cover of 9.9 times, which is more than adequate. Also good is that ANA Holdings grew its EBIT at 18% over the last year, further increasing its ability to manage debt. The balance sheet is clearly the area to focus on when you are analysing debt. But ultimately the future profitability of the business will decide if ANA Holdings can strengthen its balance sheet over time. So if you want to see what the professionals think, you might find this free report on analyst profit forecasts to be interesting.
Finally, a company can only pay off debt with cold hard cash, not accounting profits. So we clearly need to look at whether that EBIT is leading to corresponding free cash flow. Over the last two years, ANA Holdings actually produced more free cash flow than EBIT. There's nothing better than incoming cash when it comes to staying in your lenders' good graces.
Our View
ANA Holdings's conversion of EBIT to free cash flow suggests it can handle its debt as easily as Cristiano Ronaldo could score a goal against an under 14's goalkeeper. But truth be told we feel its level of total liabilities does undermine this impression a bit. Taking all this data into account, it seems to us that ANA Holdings takes a pretty sensible approach to debt. While that brings some risk, it can also enhance returns for shareholders. Above most other metrics, we think its important to track how fast earnings per share is growing, if at all. If you've also come to that realization, you're in luck, because today you can view this interactive graph of ANA Holdings's earnings per share history for free.
When all is said and done, sometimes its easier to focus on companies that don't even need debt. Readers can access a list of growth stocks with zero net debt 100% free, right now.
New: Manage All Your Stock Portfolios in One Place
We've created the ultimate portfolio companion for stock investors, and it's free.
• Connect an unlimited number of Portfolios and see your total in one currency
• Be alerted to new Warning Signs or Risks via email or mobile
• Track the Fair Value of your stocks
Have feedback on this article? Concerned about the content? Get in touch with us directly. Alternatively, email editorial-team (at) simplywallst.com.
This article by Simply Wall St is general in nature. We provide commentary based on historical data and analyst forecasts only using an unbiased methodology and our articles are not intended to be financial advice. It does not constitute a recommendation to buy or sell any stock, and does not take account of your objectives, or your financial situation. We aim to bring you long-term focused analysis driven by fundamental data. Note that our analysis may not factor in the latest price-sensitive company announcements or qualitative material. Simply Wall St has no position in any stocks mentioned.
About TSE:9202
ANA Holdings
Provides air transportation services in Japan and internationally.
Excellent balance sheet and good value.
Similar Companies
Market Insights

Community Narratives
