
Advertisement
- Japan
- /
- Interactive Media and Services
- /
- TSE:7356
Retty Inc. (TSE:7356) Shares May Have Slumped 32% But Getting In Cheap Is Still Unlikely

Retty Inc. (TSE:7356) shareholders that were waiting for something to happen have been dealt a blow with a 32% share price drop in the last month. The drop over the last 30 days has capped off a tough year for shareholders, with the share price down 44% in that time.
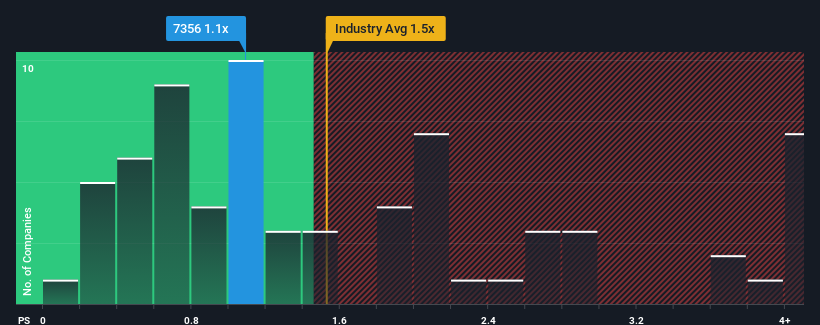
In spite of the heavy fall in price, there still wouldn't be many who think Retty's price-to-sales (or "P/S") ratio of 1.1x is worth a mention when the median P/S in Japan's Interactive Media and Services industry is similar at about 1.5x. Although, it's not wise to simply ignore the P/S without explanation as investors may be disregarding a distinct opportunity or a costly mistake.
See our latest analysis for Retty
How Retty Has Been Performing
For example, consider that Retty's financial performance has been poor lately as its revenue has been in decline. Perhaps investors believe the recent revenue performance is enough to keep in line with the industry, which is keeping the P/S from dropping off. If you like the company, you'd at least be hoping this is the case so that you could potentially pick up some stock while it's not quite in favour.
We don't have analyst forecasts, but you can see how recent trends are setting up the company for the future by checking out our free report on Retty's earnings, revenue and cash flow.How Is Retty's Revenue Growth Trending?
Retty's P/S ratio would be typical for a company that's only expected to deliver moderate growth, and importantly, perform in line with the industry.
Retrospectively, the last year delivered a frustrating 9.2% decrease to the company's top line. As a result, revenue from three years ago have also fallen 22% overall. So unfortunately, we have to acknowledge that the company has not done a great job of growing revenue over that time.
In contrast to the company, the rest of the industry is expected to grow by 11% over the next year, which really puts the company's recent medium-term revenue decline into perspective.
With this in mind, we find it worrying that Retty's P/S exceeds that of its industry peers. It seems most investors are ignoring the recent poor growth rate and are hoping for a turnaround in the company's business prospects. Only the boldest would assume these prices are sustainable as a continuation of recent revenue trends is likely to weigh on the share price eventually.
What We Can Learn From Retty's P/S?
With its share price dropping off a cliff, the P/S for Retty looks to be in line with the rest of the Interactive Media and Services industry. While the price-to-sales ratio shouldn't be the defining factor in whether you buy a stock or not, it's quite a capable barometer of revenue expectations.
We find it unexpected that Retty trades at a P/S ratio that is comparable to the rest of the industry, despite experiencing declining revenues during the medium-term, while the industry as a whole is expected to grow. When we see revenue heading backwards in the context of growing industry forecasts, it'd make sense to expect a possible share price decline on the horizon, sending the moderate P/S lower. If recent medium-term revenue trends continue, it will place shareholders' investments at risk and potential investors in danger of paying an unnecessary premium.
And what about other risks? Every company has them, and we've spotted 3 warning signs for Retty (of which 2 can't be ignored!) you should know about.
If companies with solid past earnings growth is up your alley, you may wish to see this free collection of other companies with strong earnings growth and low P/E ratios.
New: AI Stock Screener & Alerts
Our new AI Stock Screener scans the market every day to uncover opportunities.
• Dividend Powerhouses (3%+ Yield)
• Undervalued Small Caps with Insider Buying
• High growth Tech and AI Companies
Or build your own from over 50 metrics.
Have feedback on this article? Concerned about the content? Get in touch with us directly. Alternatively, email editorial-team (at) simplywallst.com.
This article by Simply Wall St is general in nature. We provide commentary based on historical data and analyst forecasts only using an unbiased methodology and our articles are not intended to be financial advice. It does not constitute a recommendation to buy or sell any stock, and does not take account of your objectives, or your financial situation. We aim to bring you long-term focused analysis driven by fundamental data. Note that our analysis may not factor in the latest price-sensitive company announcements or qualitative material. Simply Wall St has no position in any stocks mentioned.
Have feedback on this article? Concerned about the content? Get in touch with us directly. Alternatively, email editorial-team@simplywallst.com
About TSE:7356
Excellent balance sheet and overvalued.
Market Insights

Advertisement
Community Narratives
RIO is poised to weather a depressed iron ore environment, but commodity diversification comes with lower margins
Fair Value AU$110.51|4.0% overvalued
DU
Community Contributor
The demand for personalized medicine will keep Thermo Fisher Scientific thriving
Fair Value US$540.27|21.5% undervalued
UN
Community Contributor
Silver Play by A Family with 10x Potential
Fair Value UK£24.00|88.8% undervalued
RO
Community Contributor