
Advertisement

Legendary fund manager Li Lu (who Charlie Munger backed) once said, 'The biggest investment risk is not the volatility of prices, but whether you will suffer a permanent loss of capital.' So it seems the smart money knows that debt - which is usually involved in bankruptcies - is a very important factor, when you assess how risky a company is. As with many other companies LY Corporation (TSE:4689) makes use of debt. But the real question is whether this debt is making the company risky.
We check all companies for important risks. See what we found for LY in our free report.When Is Debt A Problem?
Debt and other liabilities become risky for a business when it cannot easily fulfill those obligations, either with free cash flow or by raising capital at an attractive price. Part and parcel of capitalism is the process of 'creative destruction' where failed businesses are mercilessly liquidated by their bankers. However, a more common (but still painful) scenario is that it has to raise new equity capital at a low price, thus permanently diluting shareholders. Of course, debt can be an important tool in businesses, particularly capital heavy businesses. When we think about a company's use of debt, we first look at cash and debt together.
How Much Debt Does LY Carry?
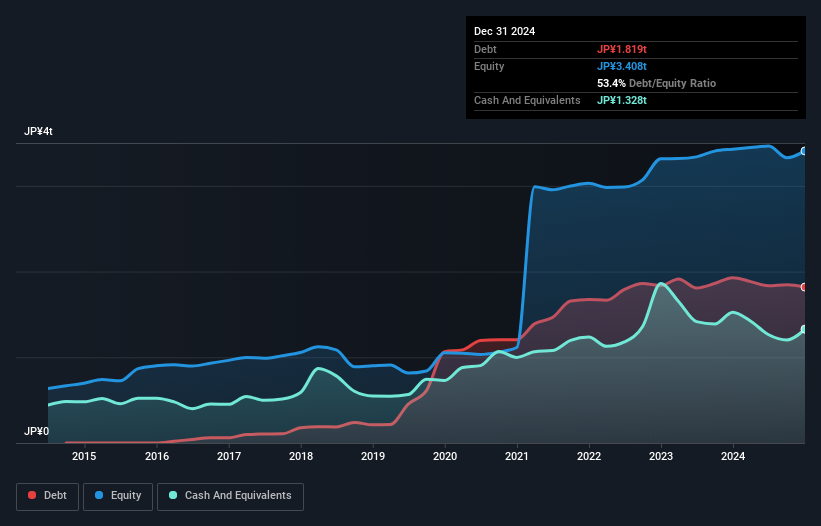
As you can see below, LY had JP¥1.82t of debt at December 2024, down from JP¥1.93t a year prior. However, it also had JP¥1.33t in cash, and so its net debt is JP¥491.0b.
A Look At LY's Liabilities
Zooming in on the latest balance sheet data, we can see that LY had liabilities of JP¥3.78t due within 12 months and liabilities of JP¥2.26t due beyond that. On the other hand, it had cash of JP¥1.33t and JP¥1.75t worth of receivables due within a year. So its liabilities outweigh the sum of its cash and (near-term) receivables by JP¥2.96t.
This is a mountain of leverage even relative to its gargantuan market capitalization of JP¥3.76t. This suggests shareholders would be heavily diluted if the company needed to shore up its balance sheet in a hurry.
Check out our latest analysis for LY
We measure a company's debt load relative to its earnings power by looking at its net debt divided by its earnings before interest, tax, depreciation, and amortization (EBITDA) and by calculating how easily its earnings before interest and tax (EBIT) cover its interest expense (interest cover). This way, we consider both the absolute quantum of the debt, as well as the interest rates paid on it.
LY's net debt is only 1.2 times its EBITDA. And its EBIT easily covers its interest expense, being 231 times the size. So you could argue it is no more threatened by its debt than an elephant is by a mouse. On top of that, LY grew its EBIT by 42% over the last twelve months, and that growth will make it easier to handle its debt. When analysing debt levels, the balance sheet is the obvious place to start. But it is future earnings, more than anything, that will determine LY's ability to maintain a healthy balance sheet going forward. So if you want to see what the professionals think, you might find this free report on analyst profit forecasts to be interesting.
Finally, a company can only pay off debt with cold hard cash, not accounting profits. So the logical step is to look at the proportion of that EBIT that is matched by actual free cash flow. During the last three years, LY generated free cash flow amounting to a very robust 98% of its EBIT, more than we'd expect. That positions it well to pay down debt if desirable to do so.
Our View
LY's interest cover suggests it can handle its debt as easily as Cristiano Ronaldo could score a goal against an under 14's goalkeeper. But truth be told we feel its level of total liabilities does undermine this impression a bit. When we consider the range of factors above, it looks like LY is pretty sensible with its use of debt. That means they are taking on a bit more risk, in the hope of boosting shareholder returns. Above most other metrics, we think its important to track how fast earnings per share is growing, if at all. If you've also come to that realization, you're in luck, because today you can view this interactive graph of LY's earnings per share history for free.
If you're interested in investing in businesses that can grow profits without the burden of debt, then check out this free list of growing businesses that have net cash on the balance sheet.
New: AI Stock Screener & Alerts
Our new AI Stock Screener scans the market every day to uncover opportunities.
• Dividend Powerhouses (3%+ Yield)
• Undervalued Small Caps with Insider Buying
• High growth Tech and AI Companies
Or build your own from over 50 metrics.
Have feedback on this article? Concerned about the content? Get in touch with us directly. Alternatively, email editorial-team (at) simplywallst.com.
This article by Simply Wall St is general in nature. We provide commentary based on historical data and analyst forecasts only using an unbiased methodology and our articles are not intended to be financial advice. It does not constitute a recommendation to buy or sell any stock, and does not take account of your objectives, or your financial situation. We aim to bring you long-term focused analysis driven by fundamental data. Note that our analysis may not factor in the latest price-sensitive company announcements or qualitative material. Simply Wall St has no position in any stocks mentioned.
About TSE:4689
Flawless balance sheet with moderate growth potential.
Similar Companies
Market Insights

Advertisement
Community Narratives
RIO is poised to weather a depressed iron ore environment, but commodity diversification comes with lower margins
Fair Value AU$110.51|4.1% overvalued
DU
Community Contributor
The demand for personalized medicine will keep Thermo Fisher Scientific thriving
Fair Value US$540.27|22.0% undervalued
UN
Community Contributor
Silver Play by A Family with 10x Potential
Fair Value UK£24.00|88.6% undervalued
RO
Community Contributor