
Advertisement
Ultrafabrics HoldingsLtd (TSE:4235) shareholders have lost 41% over 1 year, earnings decline likely the culprit

Passive investing in an index fund is a good way to ensure your own returns roughly match the overall market. While individual stocks can be big winners, plenty more fail to generate satisfactory returns. Unfortunately the Ultrafabrics Holdings Co.,Ltd. (TSE:4235) share price slid 44% over twelve months. That's disappointing when you consider the market declined 2.1%. To make matters worse, the returns over three years have also been really disappointing (the share price is 41% lower than three years ago). The falls have accelerated recently, with the share price down 25% in the last three months. We note that the company has reported results fairly recently; and the market is hardly delighted. You can check out the latest numbers in our company report.
After losing 10% this past week, it's worth investigating the company's fundamentals to see what we can infer from past performance.
In his essay The Superinvestors of Graham-and-Doddsville Warren Buffett described how share prices do not always rationally reflect the value of a business. By comparing earnings per share (EPS) and share price changes over time, we can get a feel for how investor attitudes to a company have morphed over time.
Unfortunately Ultrafabrics HoldingsLtd reported an EPS drop of 50% for the last year. This proportional reduction in earnings per share isn't far from the 44% decrease in the share price. Therefore one could posit that the market has not become more concerned about the company, despite the lower EPS. Instead, the change in the share price seems to reduction in earnings per share, alone.
You can see how EPS has changed over time in the image below (click on the chart to see the exact values).
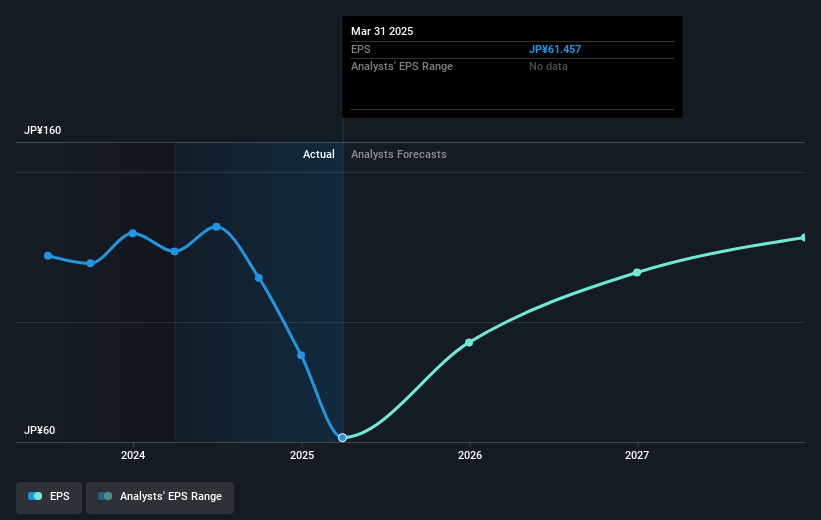
Dive deeper into Ultrafabrics HoldingsLtd's key metrics by checking this interactive graph of Ultrafabrics HoldingsLtd's earnings, revenue and cash flow.
What About Dividends?
It is important to consider the total shareholder return, as well as the share price return, for any given stock. The TSR is a return calculation that accounts for the value of cash dividends (assuming that any dividend received was reinvested) and the calculated value of any discounted capital raisings and spin-offs. Arguably, the TSR gives a more comprehensive picture of the return generated by a stock. We note that for Ultrafabrics HoldingsLtd the TSR over the last 1 year was -41%, which is better than the share price return mentioned above. This is largely a result of its dividend payments!
A Different Perspective
While the broader market gained around 2.1% in the last year, Ultrafabrics HoldingsLtd shareholders lost 41% (even including dividends). However, keep in mind that even the best stocks will sometimes underperform the market over a twelve month period. On the bright side, long term shareholders have made money, with a gain of 10% per year over half a decade. If the fundamental data continues to indicate long term sustainable growth, the current sell-off could be an opportunity worth considering. While it is well worth considering the different impacts that market conditions can have on the share price, there are other factors that are even more important. Consider for instance, the ever-present spectre of investment risk. We've identified 5 warning signs with Ultrafabrics HoldingsLtd , and understanding them should be part of your investment process.
If you like to buy stocks alongside management, then you might just love this free list of companies. (Hint: many of them are unnoticed AND have attractive valuation).
Please note, the market returns quoted in this article reflect the market weighted average returns of stocks that currently trade on Japanese exchanges.
New: AI Stock Screener & Alerts
Our new AI Stock Screener scans the market every day to uncover opportunities.
• Dividend Powerhouses (3%+ Yield)
• Undervalued Small Caps with Insider Buying
• High growth Tech and AI Companies
Or build your own from over 50 metrics.
Have feedback on this article? Concerned about the content? Get in touch with us directly. Alternatively, email editorial-team (at) simplywallst.com.
This article by Simply Wall St is general in nature. We provide commentary based on historical data and analyst forecasts only using an unbiased methodology and our articles are not intended to be financial advice. It does not constitute a recommendation to buy or sell any stock, and does not take account of your objectives, or your financial situation. We aim to bring you long-term focused analysis driven by fundamental data. Note that our analysis may not factor in the latest price-sensitive company announcements or qualitative material. Simply Wall St has no position in any stocks mentioned.
About TSE:4235
Ultrafabrics HoldingsLtd
Manufactures and sells polyurethane leather products in Japan, North America, Europe, and internationally.
Established dividend payer moderate.
Market Insights

Advertisement
Community Narratives
Scaling up in building materials with smart M&A and growing profitability
Fair Value US$2.77|28.9% undervalued
CM
Community Contributor
Hims: The Platform Powering Personalised Healthcare
Fair Value US$114.01|46.3% undervalued
BL
Community Contributor
Undervalued lottery company with strong fundamentals
Fair Value AU$15.00|33.9% undervalued
RO
Community Contributor
Proximus, transferring money from the impatient to the patient investor
Fair Value €16.62|56.1% undervalued
AX
Community Contributor