
Advertisement

Some say volatility, rather than debt, is the best way to think about risk as an investor, but Warren Buffett famously said that 'Volatility is far from synonymous with risk.' It's only natural to consider a company's balance sheet when you examine how risky it is, since debt is often involved when a business collapses. We can see that UCHIYAMA HOLDINGS Co.,Ltd. (TSE:6059) does use debt in its business. But is this debt a concern to shareholders?
What Risk Does Debt Bring?
Generally speaking, debt only becomes a real problem when a company can't easily pay it off, either by raising capital or with its own cash flow. In the worst case scenario, a company can go bankrupt if it cannot pay its creditors. However, a more frequent (but still costly) occurrence is where a company must issue shares at bargain-basement prices, permanently diluting shareholders, just to shore up its balance sheet. Having said that, the most common situation is where a company manages its debt reasonably well - and to its own advantage. The first step when considering a company's debt levels is to consider its cash and debt together.
View our latest analysis for UCHIYAMA HOLDINGSLtd
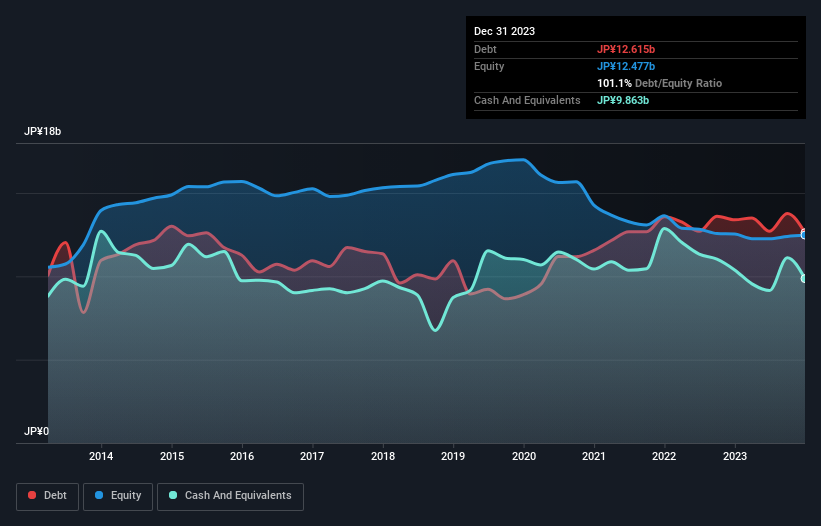
How Much Debt Does UCHIYAMA HOLDINGSLtd Carry?
The image below, which you can click on for greater detail, shows that UCHIYAMA HOLDINGSLtd had debt of JP¥12.6b at the end of December 2023, a reduction from JP¥13.4b over a year. However, it also had JP¥9.86b in cash, and so its net debt is JP¥2.75b.
How Healthy Is UCHIYAMA HOLDINGSLtd's Balance Sheet?
The latest balance sheet data shows that UCHIYAMA HOLDINGSLtd had liabilities of JP¥8.45b due within a year, and liabilities of JP¥9.10b falling due after that. Offsetting this, it had JP¥9.86b in cash and JP¥2.65b in receivables that were due within 12 months. So it has liabilities totalling JP¥5.03b more than its cash and near-term receivables, combined.
This is a mountain of leverage relative to its market capitalization of JP¥7.77b. This suggests shareholders would be heavily diluted if the company needed to shore up its balance sheet in a hurry.
We use two main ratios to inform us about debt levels relative to earnings. The first is net debt divided by earnings before interest, tax, depreciation, and amortization (EBITDA), while the second is how many times its earnings before interest and tax (EBIT) covers its interest expense (or its interest cover, for short). Thus we consider debt relative to earnings both with and without depreciation and amortization expenses.
UCHIYAMA HOLDINGSLtd has net debt to EBITDA of 2.9 suggesting it uses a fair bit of leverage to boost returns. On the plus side, its EBIT was 9.2 times its interest expense, and its net debt to EBITDA, was quite high, at 2.9. Notably, UCHIYAMA HOLDINGSLtd made a loss at the EBIT level, last year, but improved that to positive EBIT of JP¥249m in the last twelve months. There's no doubt that we learn most about debt from the balance sheet. But it is UCHIYAMA HOLDINGSLtd's earnings that will influence how the balance sheet holds up in the future. So if you're keen to discover more about its earnings, it might be worth checking out this graph of its long term earnings trend.
Finally, a company can only pay off debt with cold hard cash, not accounting profits. So it's worth checking how much of the earnings before interest and tax (EBIT) is backed by free cash flow. During the last year, UCHIYAMA HOLDINGSLtd burned a lot of cash. While that may be a result of expenditure for growth, it does make the debt far more risky.
Our View
We'd go so far as to say UCHIYAMA HOLDINGSLtd's conversion of EBIT to free cash flow was disappointing. But on the bright side, its interest cover is a good sign, and makes us more optimistic. We should also note that Healthcare industry companies like UCHIYAMA HOLDINGSLtd commonly do use debt without problems. Once we consider all the factors above, together, it seems to us that UCHIYAMA HOLDINGSLtd's debt is making it a bit risky. Some people like that sort of risk, but we're mindful of the potential pitfalls, so we'd probably prefer it carry less debt. When analysing debt levels, the balance sheet is the obvious place to start. But ultimately, every company can contain risks that exist outside of the balance sheet. For example UCHIYAMA HOLDINGSLtd has 4 warning signs (and 2 which don't sit too well with us) we think you should know about.
At the end of the day, it's often better to focus on companies that are free from net debt. You can access our special list of such companies (all with a track record of profit growth). It's free.
New: AI Stock Screener & Alerts
Our new AI Stock Screener scans the market every day to uncover opportunities.
• Dividend Powerhouses (3%+ Yield)
• Undervalued Small Caps with Insider Buying
• High growth Tech and AI Companies
Or build your own from over 50 metrics.
Have feedback on this article? Concerned about the content? Get in touch with us directly. Alternatively, email editorial-team (at) simplywallst.com.
This article by Simply Wall St is general in nature. We provide commentary based on historical data and analyst forecasts only using an unbiased methodology and our articles are not intended to be financial advice. It does not constitute a recommendation to buy or sell any stock, and does not take account of your objectives, or your financial situation. We aim to bring you long-term focused analysis driven by fundamental data. Note that our analysis may not factor in the latest price-sensitive company announcements or qualitative material. Simply Wall St has no position in any stocks mentioned.
About TSE:6059
Solid track record with adequate balance sheet.
Market Insights

Advertisement
Community Narratives
RIO is poised to weather a depressed iron ore environment, but commodity diversification comes with lower margins
Fair Value AU$110.51|4.0% overvalued
DU
Community Contributor
The demand for personalized medicine will keep Thermo Fisher Scientific thriving
Fair Value US$540.27|21.5% undervalued
UN
Community Contributor
Silver Play by A Family with 10x Potential
Fair Value UK£24.00|88.8% undervalued
RO
Community Contributor