Yomeishu SeizoLtd (TSE:2540) shareholders notch a 27% CAGR over 3 years, yet earnings have been shrinking


One simple way to benefit from the stock market is to buy an index fund. But if you pick the right individual stocks, you could make more than that. For example, the Yomeishu Seizo Co.,Ltd. (TSE:2540) share price is up 91% in the last three years, clearly besting the market return of around 32% (not including dividends). On the other hand, the returns haven't been quite so good recently, with shareholders up just 42%, including dividends.
The past week has proven to be lucrative for Yomeishu SeizoLtd investors, so let's see if fundamentals drove the company's three-year performance.
Our free stock report includes 1 warning sign investors should be aware of before investing in Yomeishu SeizoLtd. Read for free now.While the efficient markets hypothesis continues to be taught by some, it has been proven that markets are over-reactive dynamic systems, and investors are not always rational. One imperfect but simple way to consider how the market perception of a company has shifted is to compare the change in the earnings per share (EPS) with the share price movement.
During the three years of share price growth, Yomeishu SeizoLtd actually saw its earnings per share (EPS) drop 8.6% per year.
So we doubt that the market is looking to EPS for its main judge of the company's value. Given this situation, it makes sense to look at other metrics too.
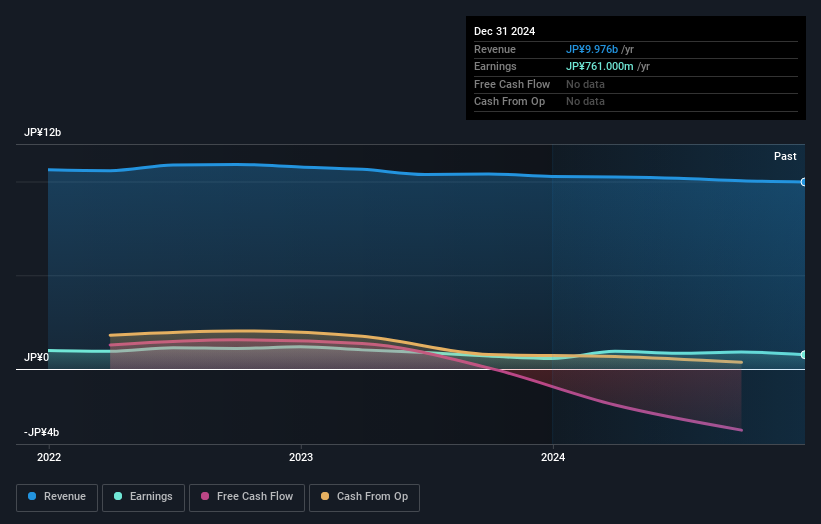
The modest 1.4% dividend yield is unlikely to be propping up the share price. The revenue drop of 2.7% is as underwhelming as some politicians. What's clear is that historic earnings and revenue aren't matching up with the share price action, very well. So you might have to dig deeper to get a grasp of the situation
You can see below how earnings and revenue have changed over time (discover the exact values by clicking on the image).
Balance sheet strength is crucial. It might be well worthwhile taking a look at our free report on how its financial position has changed over time.
What About Dividends?
As well as measuring the share price return, investors should also consider the total shareholder return (TSR). Whereas the share price return only reflects the change in the share price, the TSR includes the value of dividends (assuming they were reinvested) and the benefit of any discounted capital raising or spin-off. So for companies that pay a generous dividend, the TSR is often a lot higher than the share price return. We note that for Yomeishu SeizoLtd the TSR over the last 3 years was 104%, which is better than the share price return mentioned above. The dividends paid by the company have thusly boosted the total shareholder return.
A Different Perspective
It's good to see that Yomeishu SeizoLtd has rewarded shareholders with a total shareholder return of 42% in the last twelve months. That's including the dividend. That gain is better than the annual TSR over five years, which is 14%. Therefore it seems like sentiment around the company has been positive lately. In the best case scenario, this may hint at some real business momentum, implying that now could be a great time to delve deeper. I find it very interesting to look at share price over the long term as a proxy for business performance. But to truly gain insight, we need to consider other information, too. Even so, be aware that Yomeishu SeizoLtd is showing 1 warning sign in our investment analysis , you should know about...
If you like to buy stocks alongside management, then you might just love this free list of companies. (Hint: many of them are unnoticed AND have attractive valuation).
Please note, the market returns quoted in this article reflect the market weighted average returns of stocks that currently trade on Japanese exchanges.
New: Manage All Your Stock Portfolios in One Place
We've created the ultimate portfolio companion for stock investors, and it's free.
• Connect an unlimited number of Portfolios and see your total in one currency
• Be alerted to new Warning Signs or Risks via email or mobile
• Track the Fair Value of your stocks
Have feedback on this article? Concerned about the content? Get in touch with us directly. Alternatively, email editorial-team (at) simplywallst.com.
This article by Simply Wall St is general in nature. We provide commentary based on historical data and analyst forecasts only using an unbiased methodology and our articles are not intended to be financial advice. It does not constitute a recommendation to buy or sell any stock, and does not take account of your objectives, or your financial situation. We aim to bring you long-term focused analysis driven by fundamental data. Note that our analysis may not factor in the latest price-sensitive company announcements or qualitative material. Simply Wall St has no position in any stocks mentioned.
About TSE:2540
Yomeishu SeizoLtd
Produces and sells herbal liqueurs and pharmaceutical products in Japan, Hong Kong, Malaysia, Singapore, and Taiwan.
Flawless balance sheet with proven track record.
Market Insights

Community Narratives
