The three-year returns for Mitsui DM SugarLtd's (TSE:2109) shareholders have been stellar, yet its earnings growth was even better


One simple way to benefit from the stock market is to buy an index fund. But many of us dare to dream of bigger returns, and build a portfolio ourselves. For example, Mitsui DM Sugar Co.,Ltd. (TSE:2109) shareholders have seen the share price rise 77% over three years, well in excess of the market return (27%, not including dividends). However, more recent returns haven't been as impressive as that, with the stock returning just 15% in the last year, including dividends.
Since the stock has added JP¥9.2b to its market cap in the past week alone, let's see if underlying performance has been driving long-term returns.
To quote Buffett, 'Ships will sail around the world but the Flat Earth Society will flourish. There will continue to be wide discrepancies between price and value in the marketplace...' One way to examine how market sentiment has changed over time is to look at the interaction between a company's share price and its earnings per share (EPS).
Mitsui DM SugarLtd was able to grow its EPS at 126% per year over three years, sending the share price higher. The average annual share price increase of 21% is actually lower than the EPS growth. Therefore, it seems the market has moderated its expectations for growth, somewhat. This cautious sentiment is reflected in its (fairly low) P/E ratio of 10.01.
The image below shows how EPS has tracked over time (if you click on the image you can see greater detail).
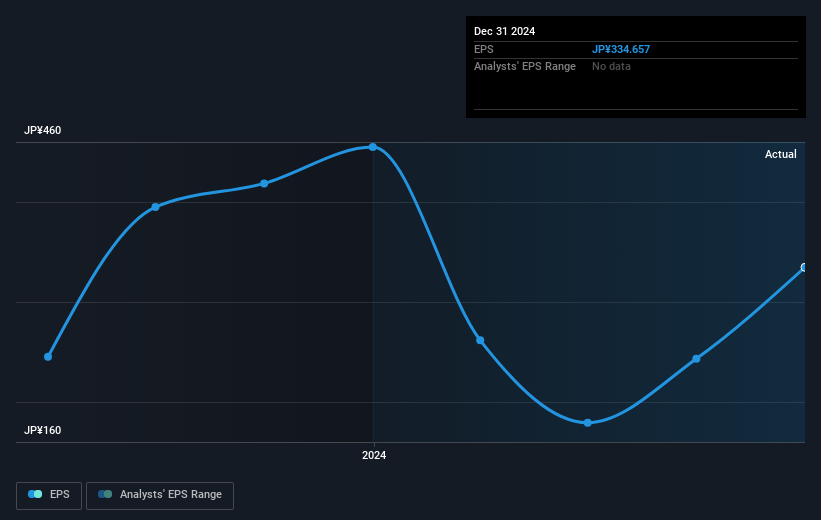
Dive deeper into Mitsui DM SugarLtd's key metrics by checking this interactive graph of Mitsui DM SugarLtd's earnings, revenue and cash flow.
What About Dividends?
As well as measuring the share price return, investors should also consider the total shareholder return (TSR). The TSR is a return calculation that accounts for the value of cash dividends (assuming that any dividend received was reinvested) and the calculated value of any discounted capital raisings and spin-offs. So for companies that pay a generous dividend, the TSR is often a lot higher than the share price return. In the case of Mitsui DM SugarLtd, it has a TSR of 104% for the last 3 years. That exceeds its share price return that we previously mentioned. And there's no prize for guessing that the dividend payments largely explain the divergence!
A Different Perspective
It's good to see that Mitsui DM SugarLtd has rewarded shareholders with a total shareholder return of 15% in the last twelve months. And that does include the dividend. That gain is better than the annual TSR over five years, which is 13%. Therefore it seems like sentiment around the company has been positive lately. Someone with an optimistic perspective could view the recent improvement in TSR as indicating that the business itself is getting better with time. It's always interesting to track share price performance over the longer term. But to understand Mitsui DM SugarLtd better, we need to consider many other factors. For example, we've discovered 2 warning signs for Mitsui DM SugarLtd that you should be aware of before investing here.
If you are like me, then you will not want to miss this free list of undervalued small caps that insiders are buying.
Please note, the market returns quoted in this article reflect the market weighted average returns of stocks that currently trade on Japanese exchanges.
New: Manage All Your Stock Portfolios in One Place
We've created the ultimate portfolio companion for stock investors, and it's free.
• Connect an unlimited number of Portfolios and see your total in one currency
• Be alerted to new Warning Signs or Risks via email or mobile
• Track the Fair Value of your stocks
Have feedback on this article? Concerned about the content? Get in touch with us directly. Alternatively, email editorial-team (at) simplywallst.com.
This article by Simply Wall St is general in nature. We provide commentary based on historical data and analyst forecasts only using an unbiased methodology and our articles are not intended to be financial advice. It does not constitute a recommendation to buy or sell any stock, and does not take account of your objectives, or your financial situation. We aim to bring you long-term focused analysis driven by fundamental data. Note that our analysis may not factor in the latest price-sensitive company announcements or qualitative material. Simply Wall St has no position in any stocks mentioned.
About TSE:2109
Mitsui DM SugarLtd
Manufactures and sells refined sugar and functional food materials in Japan.
Excellent balance sheet, good value and pays a dividend.
Market Insights

Community Narratives
