Should You Use Nadex's (TYO:7435) Statutory Earnings To Analyse It?


Statistically speaking, it is less risky to invest in profitable companies than in unprofitable ones. That said, the current statutory profit is not always a good guide to a company's underlying profitability. Today we'll focus on whether this year's statutory profits are a good guide to understanding Nadex (TYO:7435).
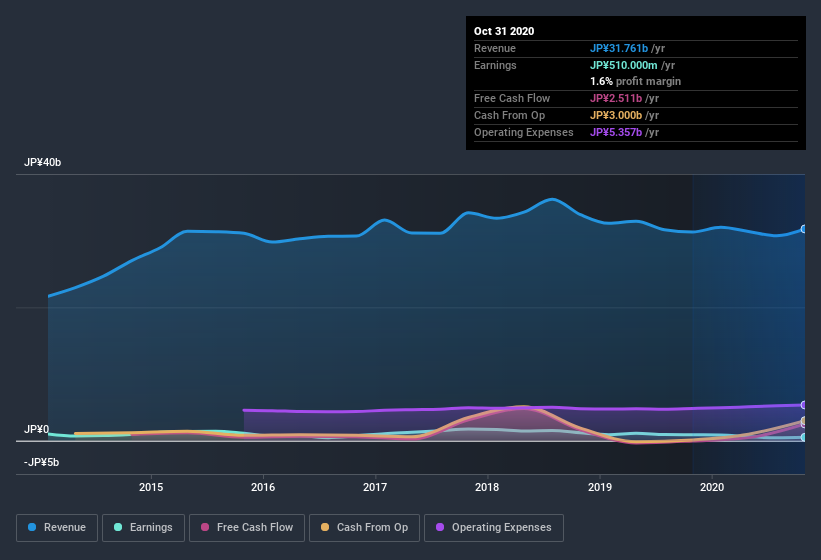
It's good to see that over the last twelve months Nadex made a profit of JP¥510.0m on revenue of JP¥31.8b. In the last few years both its revenue and its profit have fallen, as you can see in the chart below.
View our latest analysis for Nadex
Not all profits are equal, and we can learn more about the nature of a company's past profitability by diving deeper into the financial statements. Today, we'll discuss Nadex's free cashflow relative to its earnings, and consider what that tells us about the company. Note: we always recommend investors check balance sheet strength. Click here to be taken to our balance sheet analysis of Nadex.
A Closer Look At Nadex's Earnings
In high finance, the key ratio used to measure how well a company converts reported profits into free cash flow (FCF) is the accrual ratio (from cashflow). To get the accrual ratio we first subtract FCF from profit for a period, and then divide that number by the average operating assets for the period. This ratio tells us how much of a company's profit is not backed by free cashflow.
As a result, a negative accrual ratio is a positive for the company, and a positive accrual ratio is a negative. That is not intended to imply we should worry about a positive accrual ratio, but it's worth noting where the accrual ratio is rather high. That's because some academic studies have suggested that high accruals ratios tend to lead to lower profit or less profit growth.
Over the twelve months to October 2020, Nadex recorded an accrual ratio of -0.19. That indicates that its free cash flow quite significantly exceeded its statutory profit. Indeed, in the last twelve months it reported free cash flow of JP¥2.5b, well over the JP¥510.0m it reported in profit. Given that Nadex had negative free cash flow in the prior corresponding period, the trailing twelve month resul of JP¥2.5b would seem to be a step in the right direction.
Our Take On Nadex's Profit Performance
Happily for shareholders, Nadex produced plenty of free cash flow to back up its statutory profit numbers. Because of this, we think Nadex's underlying earnings potential is as good as, or possibly even better, than the statutory profit makes it seem! Unfortunately, though, its earnings per share actually fell back over the last year. At the end of the day, it's essential to consider more than just the factors above, if you want to understand the company properly. If you want to do dive deeper into Nadex, you'd also look into what risks it is currently facing. Our analysis shows 4 warning signs for Nadex (1 is a bit unpleasant!) and we strongly recommend you look at these before investing.
Today we've zoomed in on a single data point to better understand the nature of Nadex's profit. But there are plenty of other ways to inform your opinion of a company. Some people consider a high return on equity to be a good sign of a quality business. So you may wish to see this free collection of companies boasting high return on equity, or this list of stocks that insiders are buying.
When trading Nadex or any other investment, use the platform considered by many to be the Professional's Gateway to the Worlds Market, Interactive Brokers. You get the lowest-cost* trading on stocks, options, futures, forex, bonds and funds worldwide from a single integrated account. Promoted
Valuation is complex, but we're here to simplify it.
Discover if Nadex might be undervalued or overvalued with our detailed analysis, featuring fair value estimates, potential risks, dividends, insider trades, and its financial condition.
Access Free AnalysisThis article by Simply Wall St is general in nature. It does not constitute a recommendation to buy or sell any stock, and does not take account of your objectives, or your financial situation. We aim to bring you long-term focused analysis driven by fundamental data. Note that our analysis may not factor in the latest price-sensitive company announcements or qualitative material. Simply Wall St has no position in any stocks mentioned.
*Interactive Brokers Rated Lowest Cost Broker by StockBrokers.com Annual Online Review 2020
Have feedback on this article? Concerned about the content? Get in touch with us directly. Alternatively, email editorial-team (at) simplywallst.com.
About TSE:7435
Nadex
Engages in the development, manufacture, sale, and installation of welding equipment in Japan, North America, China, Southeast Asia, and internationally.
Adequate balance sheet second-rate dividend payer.
