- India
- /
- Electric Utilities
- /
- NSEI:RELINFRA
Is Reliance Infrastructure (NSE:RELINFRA) Using Too Much Debt?

Howard Marks put it nicely when he said that, rather than worrying about share price volatility, 'The possibility of permanent loss is the risk I worry about... and every practical investor I know worries about.' When we think about how risky a company is, we always like to look at its use of debt, since debt overload can lead to ruin. We note that Reliance Infrastructure Limited (NSE:RELINFRA) does have debt on its balance sheet. But should shareholders be worried about its use of debt?
What Risk Does Debt Bring?
Debt and other liabilities become risky for a business when it cannot easily fulfill those obligations, either with free cash flow or by raising capital at an attractive price. Part and parcel of capitalism is the process of 'creative destruction' where failed businesses are mercilessly liquidated by their bankers. However, a more frequent (but still costly) occurrence is where a company must issue shares at bargain-basement prices, permanently diluting shareholders, just to shore up its balance sheet. Of course, the upside of debt is that it often represents cheap capital, especially when it replaces dilution in a company with the ability to reinvest at high rates of return. The first thing to do when considering how much debt a business uses is to look at its cash and debt together.
Check out our latest analysis for Reliance Infrastructure
What Is Reliance Infrastructure's Debt?
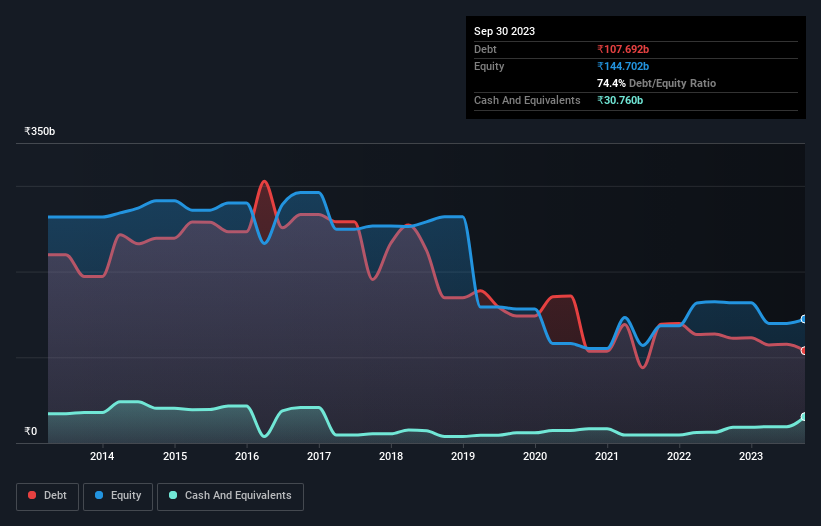
The image below, which you can click on for greater detail, shows that Reliance Infrastructure had debt of ₹107.7b at the end of September 2023, a reduction from ₹122.3b over a year. However, it does have ₹30.8b in cash offsetting this, leading to net debt of about ₹76.9b.
A Look At Reliance Infrastructure's Liabilities
We can see from the most recent balance sheet that Reliance Infrastructure had liabilities of ₹367.2b falling due within a year, and liabilities of ₹112.5b due beyond that. Offsetting this, it had ₹30.8b in cash and ₹85.1b in receivables that were due within 12 months. So its liabilities total ₹363.8b more than the combination of its cash and short-term receivables.
The deficiency here weighs heavily on the ₹90.7b company itself, as if a child were struggling under the weight of an enormous back-pack full of books, his sports gear, and a trumpet. So we definitely think shareholders need to watch this one closely. After all, Reliance Infrastructure would likely require a major re-capitalisation if it had to pay its creditors today.
We use two main ratios to inform us about debt levels relative to earnings. The first is net debt divided by earnings before interest, tax, depreciation, and amortization (EBITDA), while the second is how many times its earnings before interest and tax (EBIT) covers its interest expense (or its interest cover, for short). Thus we consider debt relative to earnings both with and without depreciation and amortization expenses.
While Reliance Infrastructure's debt to EBITDA ratio (2.5) suggests that it uses some debt, its interest cover is very weak, at 0.86, suggesting high leverage. So shareholders should probably be aware that interest expenses appear to have really impacted the business lately. Importantly, Reliance Infrastructure's EBIT fell a jaw-dropping 26% in the last twelve months. If that earnings trend continues then paying off its debt will be about as easy as herding cats on to a roller coaster. There's no doubt that we learn most about debt from the balance sheet. But it is Reliance Infrastructure's earnings that will influence how the balance sheet holds up in the future. So if you're keen to discover more about its earnings, it might be worth checking out this graph of its long term earnings trend.
Finally, a company can only pay off debt with cold hard cash, not accounting profits. So we always check how much of that EBIT is translated into free cash flow. Over the last three years, Reliance Infrastructure actually produced more free cash flow than EBIT. That sort of strong cash conversion gets us as excited as the crowd when the beat drops at a Daft Punk concert.
Our View
To be frank both Reliance Infrastructure's EBIT growth rate and its track record of staying on top of its total liabilities make us rather uncomfortable with its debt levels. But at least it's pretty decent at converting EBIT to free cash flow; that's encouraging. We should also note that Electric Utilities industry companies like Reliance Infrastructure commonly do use debt without problems. We're quite clear that we consider Reliance Infrastructure to be really rather risky, as a result of its balance sheet health. So we're almost as wary of this stock as a hungry kitten is about falling into its owner's fish pond: once bitten, twice shy, as they say. There's no doubt that we learn most about debt from the balance sheet. However, not all investment risk resides within the balance sheet - far from it. For instance, we've identified 2 warning signs for Reliance Infrastructure (1 doesn't sit too well with us) you should be aware of.
Of course, if you're the type of investor who prefers buying stocks without the burden of debt, then don't hesitate to discover our exclusive list of net cash growth stocks, today.
Mobile Infrastructure for Defense and Disaster
The next wave in robotics isn't humanoid. Its fully autonomous towers delivering 5G, ISR, and radar in under 30 minutes, anywhere.
Get the investor briefing before the next round of contracts
Sponsored On Behalf of CiTechNew: AI Stock Screener & Alerts
Our new AI Stock Screener scans the market every day to uncover opportunities.
• Dividend Powerhouses (3%+ Yield)
• Undervalued Small Caps with Insider Buying
• High growth Tech and AI Companies
Or build your own from over 50 metrics.
Have feedback on this article? Concerned about the content? Get in touch with us directly. Alternatively, email editorial-team (at) simplywallst.com.
This article by Simply Wall St is general in nature. We provide commentary based on historical data and analyst forecasts only using an unbiased methodology and our articles are not intended to be financial advice. It does not constitute a recommendation to buy or sell any stock, and does not take account of your objectives, or your financial situation. We aim to bring you long-term focused analysis driven by fundamental data. Note that our analysis may not factor in the latest price-sensitive company announcements or qualitative material. Simply Wall St has no position in any stocks mentioned.
About NSEI:RELINFRA
Reliance Infrastructure
An infrastructure company, generates, transmits, and distributes electrical power to residential, industrial, commercial, and other consumers in India.
Good value with acceptable track record.
Market Insights

Weekly Picks

THE KINGDOM OF BROWN GOODS: WHY MGPI IS BEING CRUSHED BY INVENTORY & PRIMED FOR RESURRECTION


Why Vertical Aerospace (NYSE: EVTL) is Worth Possibly Over 13x its Current Price


The Quiet Giant That Became AI’s Power Grid
Recently Updated Narratives

Butler National (Buks) outperforms.


A tech powerhouse quietly powering the world’s AI infrastructure.


Keppel DC REIT (SGX: AJBU) is a resilient gem in the data center space.
Popular Narratives

MicroVision will explode future revenue by 380.37% with a vision towards success


Crazy Undervalued 42 Baggers Silver Play (Active & Running Mine)


