
The external fund manager backed by Berkshire Hathaway's Charlie Munger, Li Lu, makes no bones about it when he says 'The biggest investment risk is not the volatility of prices, but whether you will suffer a permanent loss of capital.' When we think about how risky a company is, we always like to look at its use of debt, since debt overload can lead to ruin. Importantly, CESC Limited (NSE:CESC) does carry debt. But the real question is whether this debt is making the company risky.
When Is Debt A Problem?
Debt assists a business until the business has trouble paying it off, either with new capital or with free cash flow. In the worst case scenario, a company can go bankrupt if it cannot pay its creditors. However, a more frequent (but still costly) occurrence is where a company must issue shares at bargain-basement prices, permanently diluting shareholders, just to shore up its balance sheet. Of course, plenty of companies use debt to fund growth, without any negative consequences. The first step when considering a company's debt levels is to consider its cash and debt together.
Check out our latest analysis for CESC
How Much Debt Does CESC Carry?
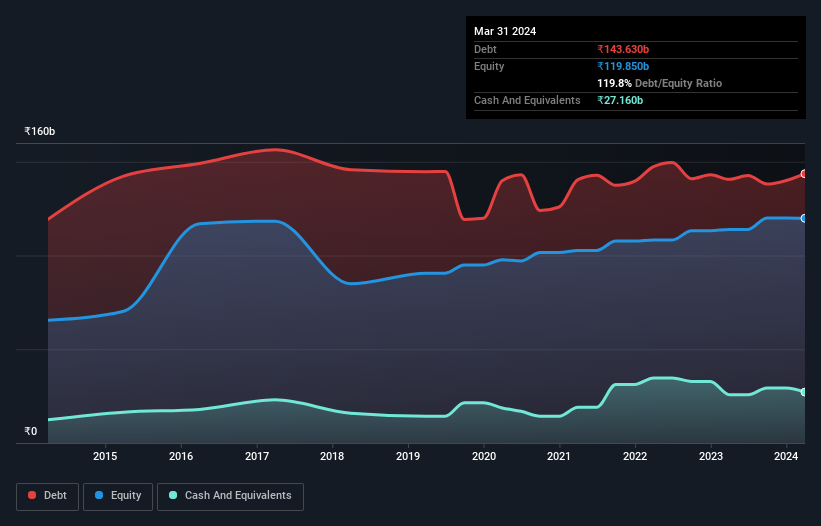
The chart below, which you can click on for greater detail, shows that CESC had ₹143.6b in debt in March 2024; about the same as the year before. However, it does have ₹27.2b in cash offsetting this, leading to net debt of about ₹116.5b.
A Look At CESC's Liabilities
The latest balance sheet data shows that CESC had liabilities of ₹69.5b due within a year, and liabilities of ₹182.4b falling due after that. Offsetting these obligations, it had cash of ₹27.2b as well as receivables valued at ₹22.9b due within 12 months. So its liabilities outweigh the sum of its cash and (near-term) receivables by ₹201.8b.
When you consider that this deficiency exceeds the company's ₹180.3b market capitalization, you might well be inclined to review the balance sheet intently. In the scenario where the company had to clean up its balance sheet quickly, it seems likely shareholders would suffer extensive dilution.
We measure a company's debt load relative to its earnings power by looking at its net debt divided by its earnings before interest, tax, depreciation, and amortization (EBITDA) and by calculating how easily its earnings before interest and tax (EBIT) cover its interest expense (interest cover). The advantage of this approach is that we take into account both the absolute quantum of debt (with net debt to EBITDA) and the actual interest expenses associated with that debt (with its interest cover ratio).
While CESC's debt to EBITDA ratio (4.9) suggests that it uses some debt, its interest cover is very weak, at 0.94, suggesting high leverage. It seems that the business incurs large depreciation and amortisation charges, so maybe its debt load is heavier than it would first appear, since EBITDA is arguably a generous measure of earnings. So shareholders should probably be aware that interest expenses appear to have really impacted the business lately. Another concern for investors might be that CESC's EBIT fell 17% in the last year. If things keep going like that, handling the debt will about as easy as bundling an angry house cat into its travel box. The balance sheet is clearly the area to focus on when you are analysing debt. But it is future earnings, more than anything, that will determine CESC's ability to maintain a healthy balance sheet going forward. So if you want to see what the professionals think, you might find this free report on analyst profit forecasts to be interesting.
Finally, a business needs free cash flow to pay off debt; accounting profits just don't cut it. So the logical step is to look at the proportion of that EBIT that is matched by actual free cash flow. During the last three years, CESC generated free cash flow amounting to a very robust 97% of its EBIT, more than we'd expect. That puts it in a very strong position to pay down debt.
Our View
To be frank both CESC's EBIT growth rate and its track record of covering its interest expense with its EBIT make us rather uncomfortable with its debt levels. But on the bright side, its conversion of EBIT to free cash flow is a good sign, and makes us more optimistic. We should also note that Electric Utilities industry companies like CESC commonly do use debt without problems. Overall, we think it's fair to say that CESC has enough debt that there are some real risks around the balance sheet. If all goes well, that should boost returns, but on the flip side, the risk of permanent capital loss is elevated by the debt. The balance sheet is clearly the area to focus on when you are analysing debt. However, not all investment risk resides within the balance sheet - far from it. For example - CESC has 1 warning sign we think you should be aware of.
If, after all that, you're more interested in a fast growing company with a rock-solid balance sheet, then check out our list of net cash growth stocks without delay.
Mobile Infrastructure for Defense and Disaster
The next wave in robotics isn't humanoid. Its fully autonomous towers delivering 5G, ISR, and radar in under 30 minutes, anywhere.
Get the investor briefing before the next round of contracts
Sponsored On Behalf of CiTechNew: AI Stock Screener & Alerts
Our new AI Stock Screener scans the market every day to uncover opportunities.
• Dividend Powerhouses (3%+ Yield)
• Undervalued Small Caps with Insider Buying
• High growth Tech and AI Companies
Or build your own from over 50 metrics.
Have feedback on this article? Concerned about the content? Get in touch with us directly. Alternatively, email editorial-team (at) simplywallst.com.
This article by Simply Wall St is general in nature. We provide commentary based on historical data and analyst forecasts only using an unbiased methodology and our articles are not intended to be financial advice. It does not constitute a recommendation to buy or sell any stock, and does not take account of your objectives, or your financial situation. We aim to bring you long-term focused analysis driven by fundamental data. Note that our analysis may not factor in the latest price-sensitive company announcements or qualitative material. Simply Wall St has no position in any stocks mentioned.
About NSEI:CESC
CESC
An integrated electrical utility company, engages in the generation and distribution of electricity in India.
6 star dividend payer and fair value.
Similar Companies
Market Insights

Weekly Picks

THE KINGDOM OF BROWN GOODS: WHY MGPI IS BEING CRUSHED BY INVENTORY & PRIMED FOR RESURRECTION


Why Vertical Aerospace (NYSE: EVTL) is Worth Possibly Over 13x its Current Price


The Quiet Giant That Became AI’s Power Grid
Recently Updated Narratives


A tech powerhouse quietly powering the world’s AI infrastructure.


Keppel DC REIT (SGX: AJBU) is a resilient gem in the data center space.
Why Vertical Aerospace (NYSE: EVTL) is Worth Possibly Over 13x its Current Price
Popular Narratives

MicroVision will explode future revenue by 380.37% with a vision towards success


Crazy Undervalued 42 Baggers Silver Play (Active & Running Mine)


