
Advertisement
- India
- /
- Basic Materials
- /
- NSEI:POKARNA
Pokarna's (NSE:POKARNA) 44% CAGR outpaced the company's earnings growth over the same five-year period

For many, the main point of investing in the stock market is to achieve spectacular returns. And highest quality companies can see their share prices grow by huge amounts. Just think about the savvy investors who held Pokarna Limited (NSE:POKARNA) shares for the last five years, while they gained 518%. This just goes to show the value creation that some businesses can achieve. Also pleasing for shareholders was the 80% gain in the last three months. It really delights us to see such great share price performance for investors.
Since it's been a strong week for Pokarna shareholders, let's have a look at trend of the longer term fundamentals.
View our latest analysis for Pokarna
To quote Buffett, 'Ships will sail around the world but the Flat Earth Society will flourish. There will continue to be wide discrepancies between price and value in the marketplace...' One way to examine how market sentiment has changed over time is to look at the interaction between a company's share price and its earnings per share (EPS).
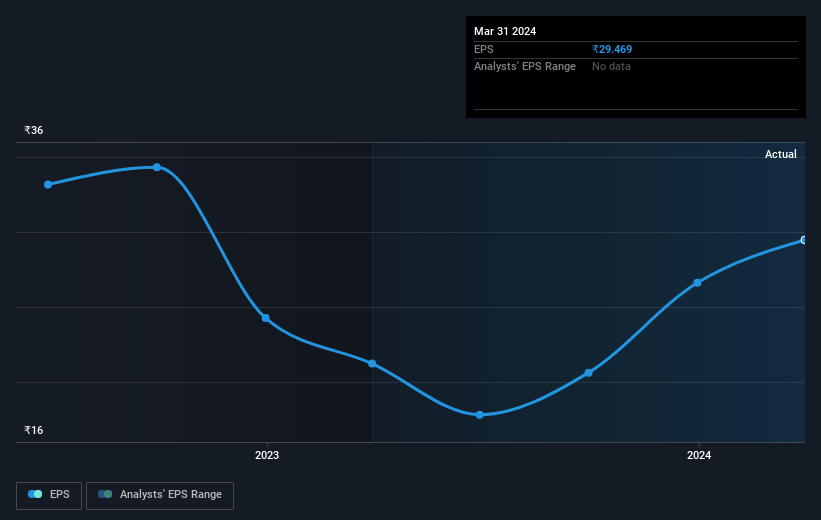
During five years of share price growth, Pokarna achieved compound earnings per share (EPS) growth of 2.5% per year. This EPS growth is lower than the 44% average annual increase in the share price. This suggests that market participants hold the company in higher regard, these days. And that's hardly shocking given the track record of growth.
You can see how EPS has changed over time in the image below (click on the chart to see the exact values).
This free interactive report on Pokarna's earnings, revenue and cash flow is a great place to start, if you want to investigate the stock further.
What About Dividends?
When looking at investment returns, it is important to consider the difference between total shareholder return (TSR) and share price return. Whereas the share price return only reflects the change in the share price, the TSR includes the value of dividends (assuming they were reinvested) and the benefit of any discounted capital raising or spin-off. Arguably, the TSR gives a more comprehensive picture of the return generated by a stock. We note that for Pokarna the TSR over the last 5 years was 526%, which is better than the share price return mentioned above. This is largely a result of its dividend payments!
A Different Perspective
We're pleased to report that Pokarna shareholders have received a total shareholder return of 105% over one year. That's including the dividend. Since the one-year TSR is better than the five-year TSR (the latter coming in at 44% per year), it would seem that the stock's performance has improved in recent times. Given the share price momentum remains strong, it might be worth taking a closer look at the stock, lest you miss an opportunity. I find it very interesting to look at share price over the long term as a proxy for business performance. But to truly gain insight, we need to consider other information, too. Consider risks, for instance. Every company has them, and we've spotted 2 warning signs for Pokarna you should know about.
If you like to buy stocks alongside management, then you might just love this free list of companies. (Hint: many of them are unnoticed AND have attractive valuation).
Please note, the market returns quoted in this article reflect the market weighted average returns of stocks that currently trade on Indian exchanges.
New: Manage All Your Stock Portfolios in One Place
We've created the ultimate portfolio companion for stock investors, and it's free.
• Connect an unlimited number of Portfolios and see your total in one currency
• Be alerted to new Warning Signs or Risks via email or mobile
• Track the Fair Value of your stocks
Have feedback on this article? Concerned about the content? Get in touch with us directly. Alternatively, email editorial-team (at) simplywallst.com.
This article by Simply Wall St is general in nature. We provide commentary based on historical data and analyst forecasts only using an unbiased methodology and our articles are not intended to be financial advice. It does not constitute a recommendation to buy or sell any stock, and does not take account of your objectives, or your financial situation. We aim to bring you long-term focused analysis driven by fundamental data. Note that our analysis may not factor in the latest price-sensitive company announcements or qualitative material. Simply Wall St has no position in any stocks mentioned.
Have feedback on this article? Concerned about the content? Get in touch with us directly. Alternatively, email editorial-team@simplywallst.com
About NSEI:POKARNA
Pokarna
Engages in quarrying, manufacture, processing, and sale of granites in India.
Outstanding track record with excellent balance sheet.
Similar Companies
Market Insights

Advertisement
Community Narratives
RIO is poised to weather a depressed iron ore environment, but commodity diversification comes with lower margins
Fair Value AU$110.51|4.0% overvalued
DU
Community Contributor
The demand for personalized medicine will keep Thermo Fisher Scientific thriving
Fair Value US$540.27|21.5% undervalued
UN
Community Contributor
Silver Play by A Family with 10x Potential
Fair Value UK£24.00|88.8% undervalued
RO
Community Contributor