- India
- /
- Metals and Mining
- /
- NSEI:CMNL
Even With A 31% Surge, Cautious Investors Are Not Rewarding Chaman Metallics Limited's (NSE:CMNL) Performance Completely

Chaman Metallics Limited (NSE:CMNL) shares have continued their recent momentum with a 31% gain in the last month alone. While recent buyers may be laughing, long-term holders might not be as pleased since the recent gain only brings the stock back to where it started a year ago.
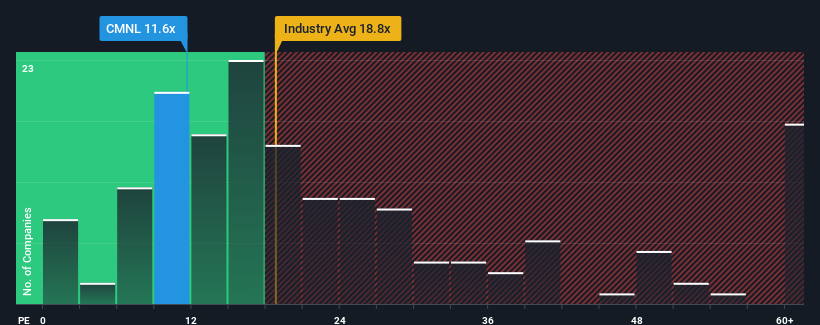
Although its price has surged higher, Chaman Metallics may still be sending very bullish signals at the moment with its price-to-earnings (or "P/E") ratio of 11.6x, since almost half of all companies in India have P/E ratios greater than 28x and even P/E's higher than 55x are not unusual. However, the P/E might be quite low for a reason and it requires further investigation to determine if it's justified.
Chaman Metallics certainly has been doing a great job lately as it's been growing earnings at a really rapid pace. It might be that many expect the strong earnings performance to degrade substantially, which has repressed the P/E. If you like the company, you'd be hoping this isn't the case so that you could potentially pick up some stock while it's out of favour.
Check out our latest analysis for Chaman Metallics
What Are Growth Metrics Telling Us About The Low P/E?
Chaman Metallics' P/E ratio would be typical for a company that's expected to deliver very poor growth or even falling earnings, and importantly, perform much worse than the market.
If we review the last year of earnings growth, the company posted a terrific increase of 94%. The strong recent performance means it was also able to grow EPS by 248% in total over the last three years. Accordingly, shareholders would have probably welcomed those medium-term rates of earnings growth.
This is in contrast to the rest of the market, which is expected to grow by 26% over the next year, materially lower than the company's recent medium-term annualised growth rates.
With this information, we find it odd that Chaman Metallics is trading at a P/E lower than the market. Apparently some shareholders believe the recent performance has exceeded its limits and have been accepting significantly lower selling prices.
The Key Takeaway
Even after such a strong price move, Chaman Metallics' P/E still trails the rest of the market significantly. Generally, our preference is to limit the use of the price-to-earnings ratio to establishing what the market thinks about the overall health of a company.
We've established that Chaman Metallics currently trades on a much lower than expected P/E since its recent three-year growth is higher than the wider market forecast. There could be some major unobserved threats to earnings preventing the P/E ratio from matching this positive performance. At least price risks look to be very low if recent medium-term earnings trends continue, but investors seem to think future earnings could see a lot of volatility.
And what about other risks? Every company has them, and we've spotted 2 warning signs for Chaman Metallics (of which 1 doesn't sit too well with us!) you should know about.
Of course, you might find a fantastic investment by looking at a few good candidates. So take a peek at this free list of companies with a strong growth track record, trading on a low P/E.
The New Payments ETF Is Live on NASDAQ:
Money is moving to real-time rails, and a newly listed ETF now gives investors direct exposure. Fast settlement. Institutional custody. Simple access.
Explore how this launch could reshape portfolios
Sponsored ContentNew: AI Stock Screener & Alerts
Our new AI Stock Screener scans the market every day to uncover opportunities.
• Dividend Powerhouses (3%+ Yield)
• Undervalued Small Caps with Insider Buying
• High growth Tech and AI Companies
Or build your own from over 50 metrics.
Have feedback on this article? Concerned about the content? Get in touch with us directly. Alternatively, email editorial-team (at) simplywallst.com.
This article by Simply Wall St is general in nature. We provide commentary based on historical data and analyst forecasts only using an unbiased methodology and our articles are not intended to be financial advice. It does not constitute a recommendation to buy or sell any stock, and does not take account of your objectives, or your financial situation. We aim to bring you long-term focused analysis driven by fundamental data. Note that our analysis may not factor in the latest price-sensitive company announcements or qualitative material. Simply Wall St has no position in any stocks mentioned.
About NSEI:CMNL
Moderate risk with weak fundamentals.
Similar Companies
Market Insights

Weekly Picks

THE KINGDOM OF BROWN GOODS: WHY MGPI IS BEING CRUSHED BY INVENTORY & PRIMED FOR RESURRECTION


Why Vertical Aerospace (NYSE: EVTL) is Worth Possibly Over 13x its Current Price


The Quiet Giant That Became AI’s Power Grid
Recently Updated Narratives

Jackson Financial Stock: When Insurance Math Meets a Shifting Claims Landscape

Stride Stock: Online Education Finds Its Second Act

CS Disco Stock: Legal AI Is Moving From Efficiency Tool to Competitive Necessity
Popular Narratives


MicroVision will explode future revenue by 380.37% with a vision towards success


Crazy Undervalued 42 Baggers Silver Play (Active & Running Mine)


