- India
- /
- Personal Products
- /
- NSEI:EMAMILTD
Emami (NSE:EMAMILTD) sheds 7.4% this week, as yearly returns fall more in line with earnings growth


Emami Limited (NSE:EMAMILTD) shareholders might be concerned after seeing the share price drop 18% in the last quarter. But that doesn't change the fact that the returns over the last three years have been very strong. In fact, the share price is up a full 106% compared to three years ago. So the recent fall in the share price should be viewed in that context. The thing to consider is whether the underlying business is doing well enough to support the current price.
In light of the stock dropping 7.4% in the past week, we want to investigate the longer term story, and see if fundamentals have been the driver of the company's positive three-year return.
Check out our latest analysis for Emami
While the efficient markets hypothesis continues to be taught by some, it has been proven that markets are over-reactive dynamic systems, and investors are not always rational. By comparing earnings per share (EPS) and share price changes over time, we can get a feel for how investor attitudes to a company have morphed over time.
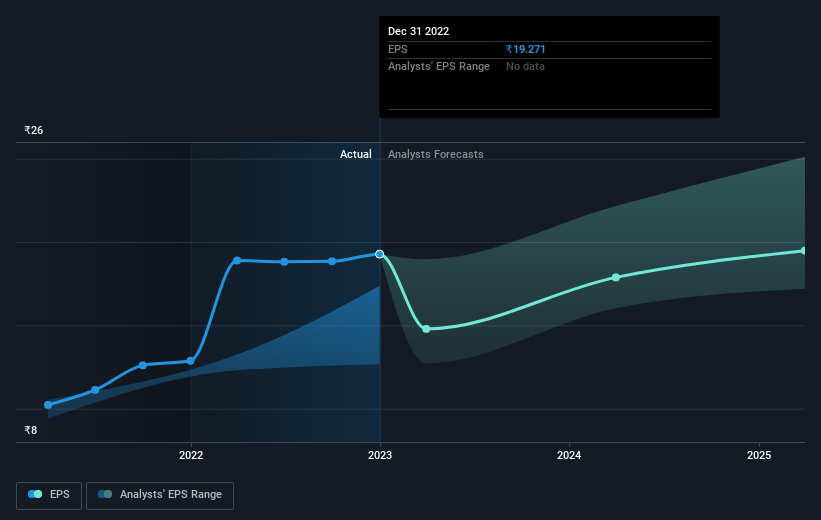
Emami was able to grow its EPS at 38% per year over three years, sending the share price higher. The average annual share price increase of 27% is actually lower than the EPS growth. So it seems investors have become more cautious about the company, over time.
The image below shows how EPS has tracked over time (if you click on the image you can see greater detail).
It's probably worth noting that the CEO is paid less than the median at similar sized companies. But while CEO remuneration is always worth checking, the really important question is whether the company can grow earnings going forward. Dive deeper into the earnings by checking this interactive graph of Emami's earnings, revenue and cash flow.
What About Dividends?
When looking at investment returns, it is important to consider the difference between total shareholder return (TSR) and share price return. The TSR is a return calculation that accounts for the value of cash dividends (assuming that any dividend received was reinvested) and the calculated value of any discounted capital raisings and spin-offs. Arguably, the TSR gives a more comprehensive picture of the return generated by a stock. In the case of Emami, it has a TSR of 120% for the last 3 years. That exceeds its share price return that we previously mentioned. The dividends paid by the company have thusly boosted the total shareholder return.
A Different Perspective
We regret to report that Emami shareholders are down 24% for the year (even including dividends). Unfortunately, that's worse than the broader market decline of 1.0%. Having said that, it's inevitable that some stocks will be oversold in a falling market. The key is to keep your eyes on the fundamental developments. Regrettably, last year's performance caps off a bad run, with the shareholders facing a total loss of 5% per year over five years. Generally speaking long term share price weakness can be a bad sign, though contrarian investors might want to research the stock in hope of a turnaround. While it is well worth considering the different impacts that market conditions can have on the share price, there are other factors that are even more important. Consider risks, for instance. Every company has them, and we've spotted 1 warning sign for Emami you should know about.
We will like Emami better if we see some big insider buys. While we wait, check out this free list of growing companies with considerable, recent, insider buying.
Please note, the market returns quoted in this article reflect the market weighted average returns of stocks that currently trade on Indian exchanges.
Valuation is complex, but we're here to simplify it.
Discover if Emami might be undervalued or overvalued with our detailed analysis, featuring fair value estimates, potential risks, dividends, insider trades, and its financial condition.
Access Free AnalysisHave feedback on this article? Concerned about the content? Get in touch with us directly. Alternatively, email editorial-team (at) simplywallst.com.
This article by Simply Wall St is general in nature. We provide commentary based on historical data and analyst forecasts only using an unbiased methodology and our articles are not intended to be financial advice. It does not constitute a recommendation to buy or sell any stock, and does not take account of your objectives, or your financial situation. We aim to bring you long-term focused analysis driven by fundamental data. Note that our analysis may not factor in the latest price-sensitive company announcements or qualitative material. Simply Wall St has no position in any stocks mentioned.
About NSEI:EMAMILTD
Emami
Manufactures and markets personal and healthcare products in India and internationally.
Flawless balance sheet with proven track record and pays a dividend.
Similar Companies
Market Insights

Community Narratives


