
Advertisement
- India
- /
- Capital Markets
- /
- NSEI:360ONE
360 One Wam's (NSE:360ONE) five-year earnings growth trails the 41% YoY shareholder returns
For many, the main point of investing in the stock market is to achieve spectacular returns. And we've seen some truly amazing gains over the years. To wit, the 360 One Wam Limited (NSE:360ONE) share price has soared 376% over five years. And this is just one example of the epic gains achieved by some long term investors. And in the last week the share price has popped 3.7%.
Since the stock has added ₹16b to its market cap in the past week alone, let's see if underlying performance has been driving long-term returns.
To quote Buffett, 'Ships will sail around the world but the Flat Earth Society will flourish. There will continue to be wide discrepancies between price and value in the marketplace...' One flawed but reasonable way to assess how sentiment around a company has changed is to compare the earnings per share (EPS) with the share price.
During five years of share price growth, 360 One Wam achieved compound earnings per share (EPS) growth of 32% per year. This EPS growth is reasonably close to the 37% average annual increase in the share price. That suggests that the market sentiment around the company hasn't changed much over that time. Indeed, it would appear the share price is reacting to the EPS.
You can see how EPS has changed over time in the image below (click on the chart to see the exact values).
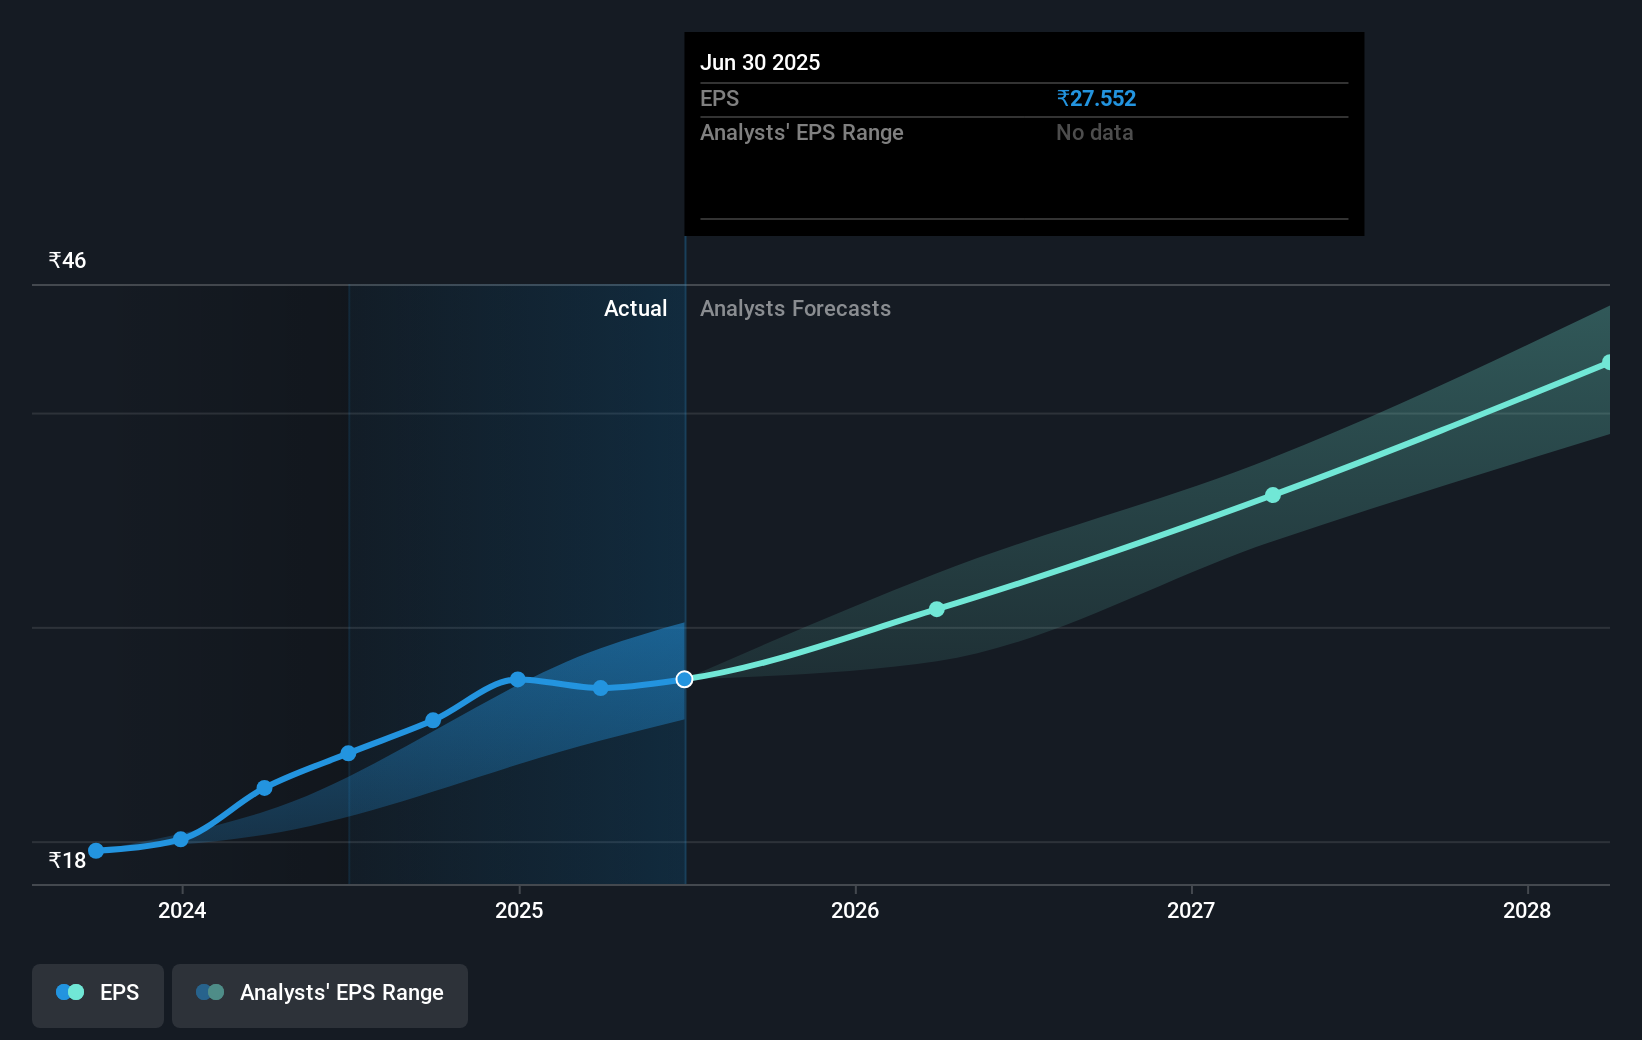
We know that 360 One Wam has improved its bottom line lately, but is it going to grow revenue? You could check out this free report showing analyst revenue forecasts.
What About Dividends?
When looking at investment returns, it is important to consider the difference between total shareholder return (TSR) and share price return. Whereas the share price return only reflects the change in the share price, the TSR includes the value of dividends (assuming they were reinvested) and the benefit of any discounted capital raising or spin-off. So for companies that pay a generous dividend, the TSR is often a lot higher than the share price return. As it happens, 360 One Wam's TSR for the last 5 years was 450%, which exceeds the share price return mentioned earlier. This is largely a result of its dividend payments!
A Different Perspective
We're pleased to report that 360 One Wam shareholders have received a total shareholder return of 4.2% over one year. And that does include the dividend. Having said that, the five-year TSR of 41% a year, is even better. Potential buyers might understandably feel they've missed the opportunity, but it's always possible business is still firing on all cylinders. It's always interesting to track share price performance over the longer term. But to understand 360 One Wam better, we need to consider many other factors. Case in point: We've spotted 2 warning signs for 360 One Wam you should be aware of, and 1 of them is significant.
If you are like me, then you will not want to miss this free list of undervalued small caps that insiders are buying.
Please note, the market returns quoted in this article reflect the market weighted average returns of stocks that currently trade on Indian exchanges.
Valuation is complex, but we're here to simplify it.
Discover if 360 One Wam might be undervalued or overvalued with our detailed analysis, featuring fair value estimates, potential risks, dividends, insider trades, and its financial condition.
Access Free AnalysisHave feedback on this article? Concerned about the content? Get in touch with us directly. Alternatively, email editorial-team (at) simplywallst.com.
This article by Simply Wall St is general in nature. We provide commentary based on historical data and analyst forecasts only using an unbiased methodology and our articles are not intended to be financial advice. It does not constitute a recommendation to buy or sell any stock, and does not take account of your objectives, or your financial situation. We aim to bring you long-term focused analysis driven by fundamental data. Note that our analysis may not factor in the latest price-sensitive company announcements or qualitative material. Simply Wall St has no position in any stocks mentioned.
About NSEI:360ONE
360 One Wam
Engages in the provision of wealth and asset management services primarily in India.
Proven track record with mediocre balance sheet.
Market Insights

Advertisement
Community Narratives
A formidable player in AI and enterprise computing.
Fair Value US$210.00|3.1% overvalued
CO
Community Contributor
IREN's Bold Moves in Sustainable Bitcoin Mining & AI Data Centers
Fair Value US$72.52|11.6% undervalued
BL
Community Contributor
Cooling the Champions: The Aussie Tech Behind F1's Victories
Fair Value AU$12.40|40.4% undervalued
TR
Community Contributor